The cycleMultiTool Indicator for eSignal |
|
The cycleMultiTool indicator is a mouse-driven cycle analysis tool for eSignal 12. It offers several of the features available in our cyclePack collection but in a much smaller footpring. The cycleMultiTool indicator will operate in charts of any bar interval (i.e., intraday, Daily, Weekly, Monthly, etc.).
The cycleMultiTool indicator provides access to three cycle analysis algorithms:
•Goertzel
•MESA
•Linear Prediction
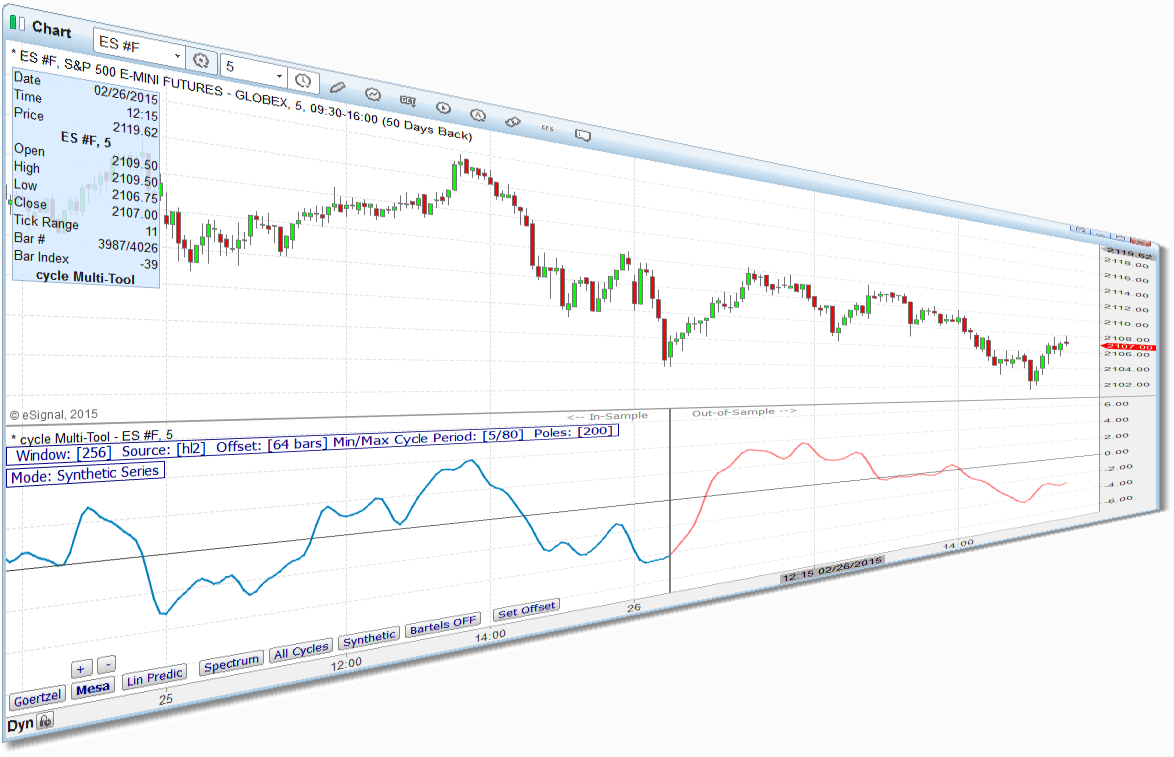
When either Goertzel or MESA is selected you will have the ability to plot a spectrum as well as to plot a synthetic series based on the cycle data (and project this series into the future). When the Linear Prediction option is selected only the synthetic series option will be available. Regardless of which algorithm is selected you will be able to set the bar offset as well as adjust a variety of parameters, via button controls and/or via the indicator's menu options.

Synthetic series example using MESA on a 5-min $SPX chart.
If you have comments, questions, or suggestions on how we can improve our product, please send an email to support@sr-analyst.com and reference cycleMultiTool in the subject line.