Harmonic Strength Index
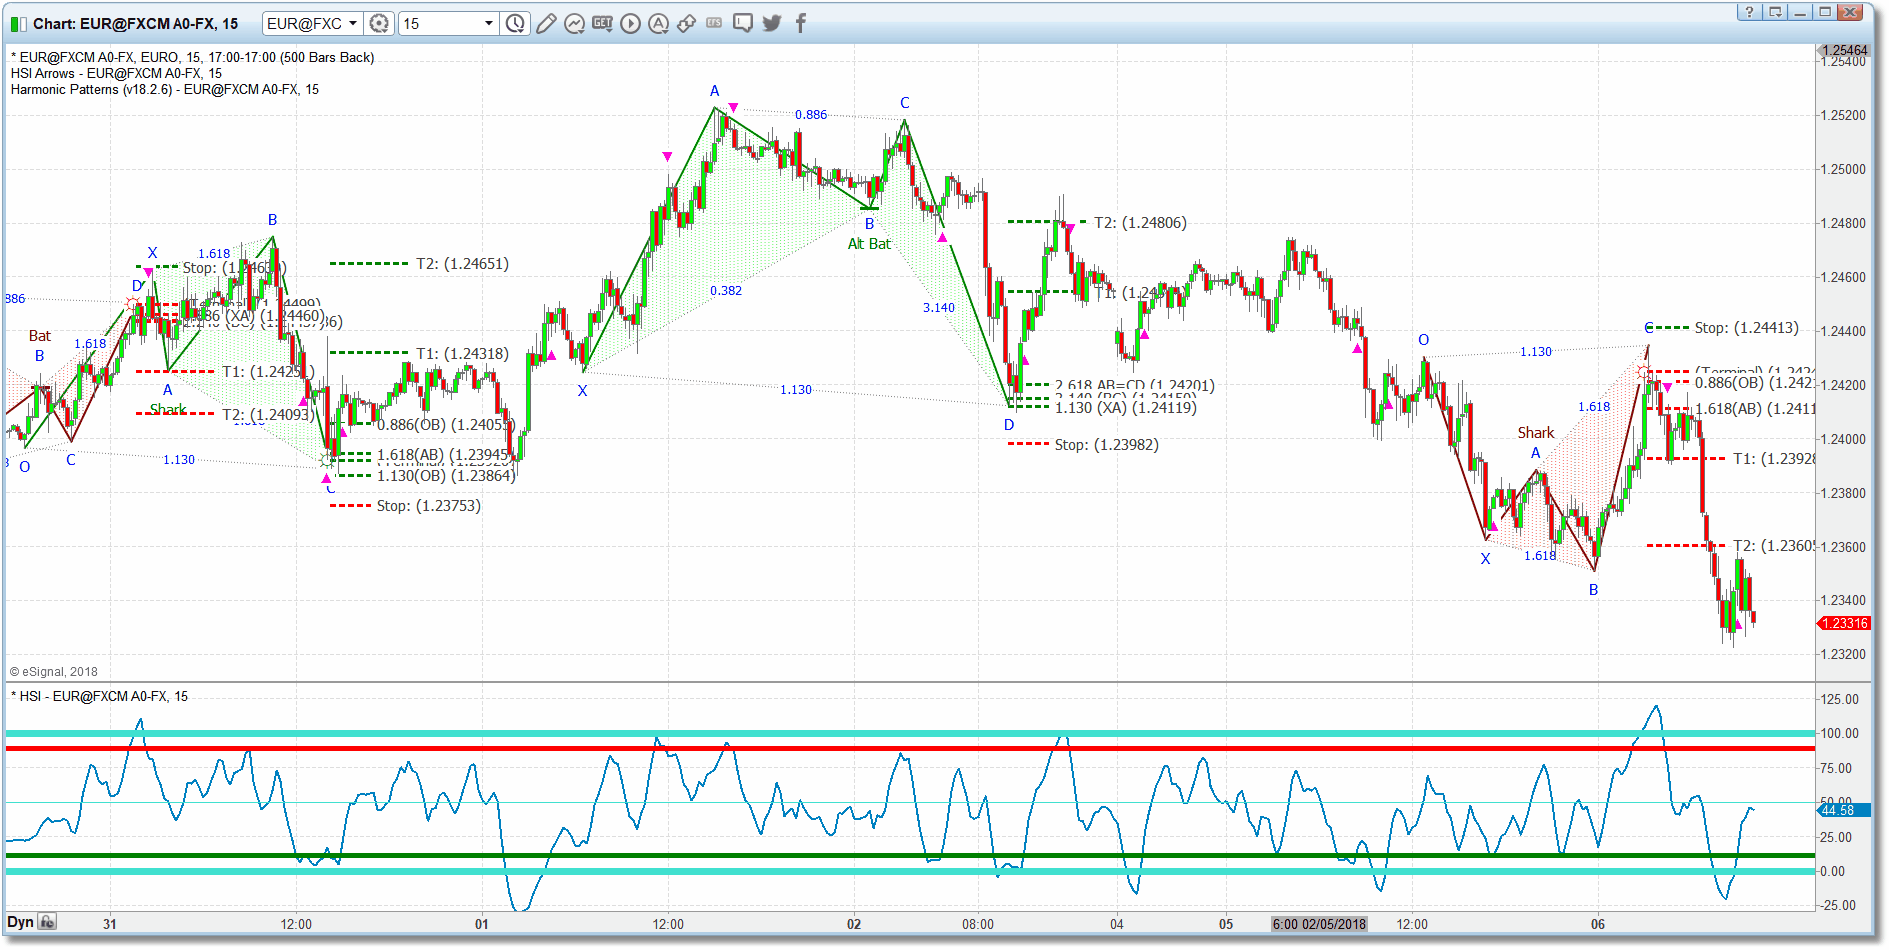
The Harmonic Strength Index (HSI) is the primary indicator for accompanying harmonic pattern identification and it is designed to replace RSI for harmonic traders.
HSI is used to confirm and identify harmonic patterns as well as to time entries within the PRZ. HSI is unique in that it oscillates at a far more active frequency than RSI while still managing to avoid extended stays above overbought/oversold or repeated false signals in close succession. Instead, HSI takes the first few hundred bars of the chart to adapt is oscillation frequency to the behavior of the instrument and then continues to update its response as time passes. The result is informative, decisive signals throughout varying levels of market volatility.
There is a companion indicator called HSI Arrows that can be loaded into the price pane. HSI Arrows will display an up-arrow below each bar where HSI crosses up through the lower threshold and a down-arrow above each bar where HSI crosses down through the upper threshold.
|
Note: The Harmonic Strength Index can also be used in a watchlist. The HSI Arrows indicator is not watchlist compatible. |
To load the Harmonic Strength Index into a chart:
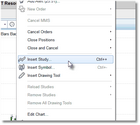
•Right-click in your chart and select the Insert Study option from the pop-up menu.
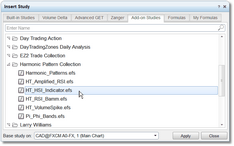
•The Insert Study dialog will be displayed. Click on the Add-on Studies tab.
•Then scroll down until you find the Harmonic Pattern Collection folder. Double-click on the folder to open it. Then click on the HT_HSI_Indicator.efs indicator to select it, click on the Apply button, and then click on the Close button to close the dialog.The Harmonic Strength Index will now be loaded in your chart.
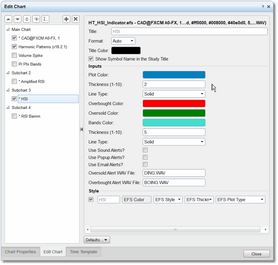
•Once the indicator has been loaded into a chart, you can access the parameters dialog by by right-clicking in the indicator pane of the chart and selecting the Edit Chart option from the pop-up menu. The parameters dialog (called Edit Chart) will be displayed:
To change settings once the Harmonic Strength Index has been
loaded into a chart, right-click in the chart and select the
Edit Chart option.
•Make your edits/changes and then click on the Close button at the bottom-right of the dialog to close the parameters dialog and return to the chart. See the HSI Settings section for a complete description of all of the available parameters.
See Also:


