
Version
As of June 2023 the current version of the Harmonic Patterns Collection for Sierra Chart is v23.06.20 and it requires Sierra Chart version 2512 or newer in order to operate.
If you are already running the Harmonic Patterns Indicator, you can determine the version by:
•Right-click in the chart;
•Select the Study Settings option and then select Harmonic Pattern Scanner from the sub-menu;
•In the Study Settings dialog, click on the Description button that you see near bottom-right of the dialog;
•The Study Description page will open in your default browser. Near the top you will see the version of the Harmonic Pattern Collection.

If your version is older, or if no version number is displayed, (or if you are just not sure) then you should install the most current version before proceeding.
The most current version is always available at this link and is in the form of a standard Windows installer program. See our Installer topic for more information on installing the Harmonic Pattern Collection indicators. If you have any issues with the installation process, please check our FAQ section and/or contact us immediately at hpc@sr-analyst.com.
Refer back to this section regularly for information on the current version. A link to the current version will always be available here as well as on the Harmonic Pattern Collection product page.
Quick Start
First step is to install the Harmonic Pattern Collection for Sierra Chart. Please review the Installer topic for instructions on how to get the product installed and how to request a trial or create a subscription. Once the product is installed, return to this page and follow the instructions below.
The easiest way to get up and running in Sierra is to create a fresh ChartBook, load a chart and add all of the HPC indicators into this chart. Adjust the individual indicator settings as needed, and then save the studies as a Study Collection in Sierra Chart. You can then create additional charts and simply add the pre-defined Study Collection to each chart.
As part of the Harmonic Pattern Collection for Sierra Chart installation we have included a sample Sierra ChartBook which contains 4 charts, and it also includes a sample Study Summary Window.
|
Note: Sierra Chart has many more options available than your "standard" charting platform, and it can be customized to a very high degree. While the sheer number of options can be a bit daunting, Sierra Chart is also one of the best documented platforms we have ever seen. All of this documentation is centrally located on the Sierra Web Site. Our focus in this User Guide is on the HPC Pattern indicators and we do not cover all of the options and permutations that are possible in Sierra Chart in terms of customization and configuration. If you have questions on the various options, please refer to the Sierra Chart documentation. |

Create a new ChartBook
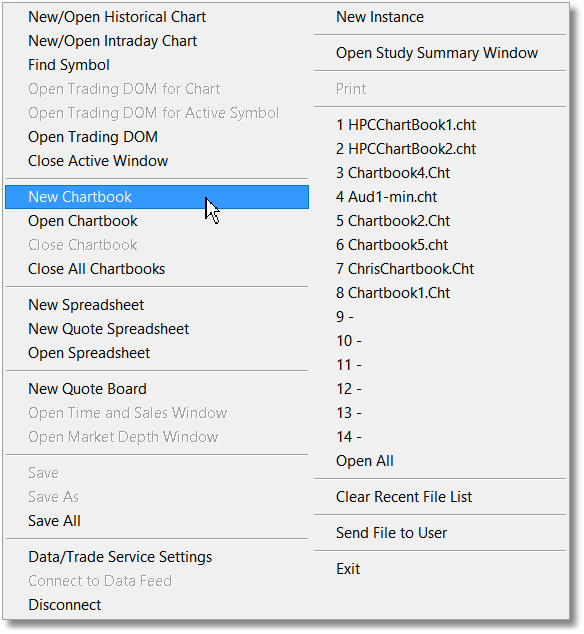
•Launch Sierra Chart and select the File option off of the main menu.
•Select the New ChartBook option from the drop-down menu. |
|
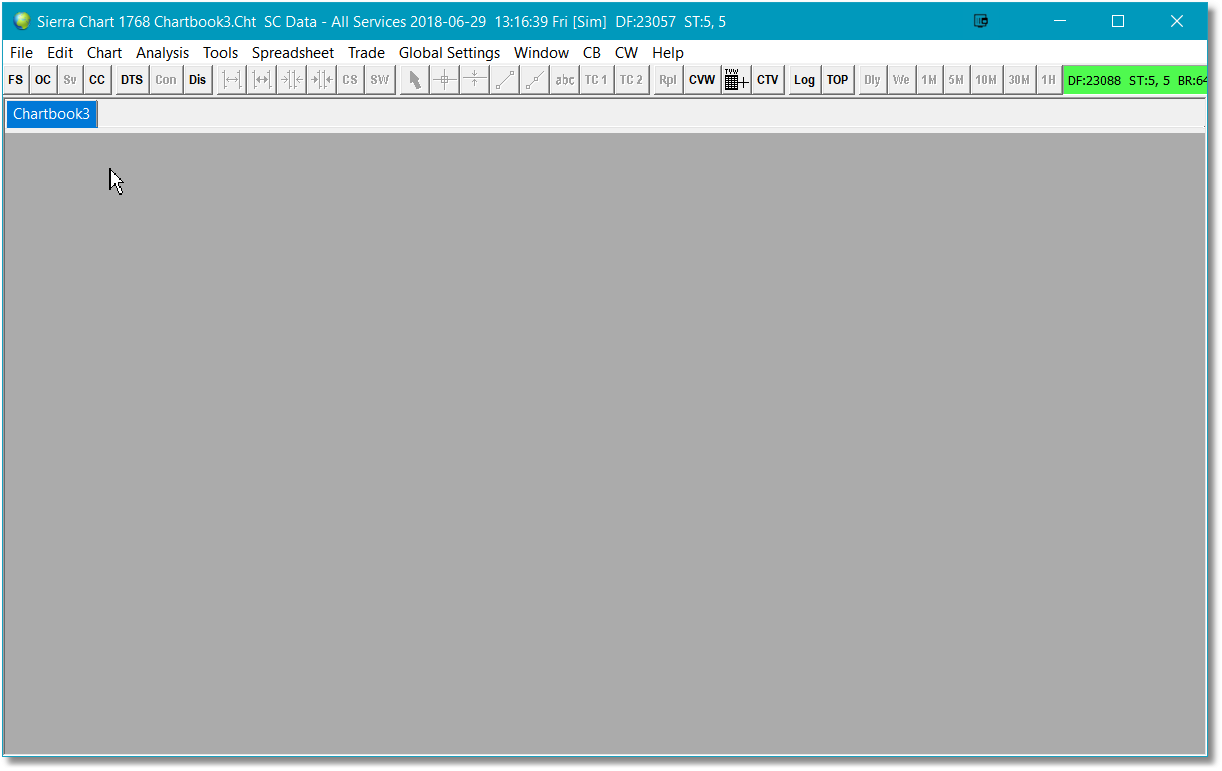
•At the top-left of your Sierra workspace, you should see a new ChartBook tab. The name will be automatically assigned at this point...you will be able to rename it after you have added a chart..
|
|
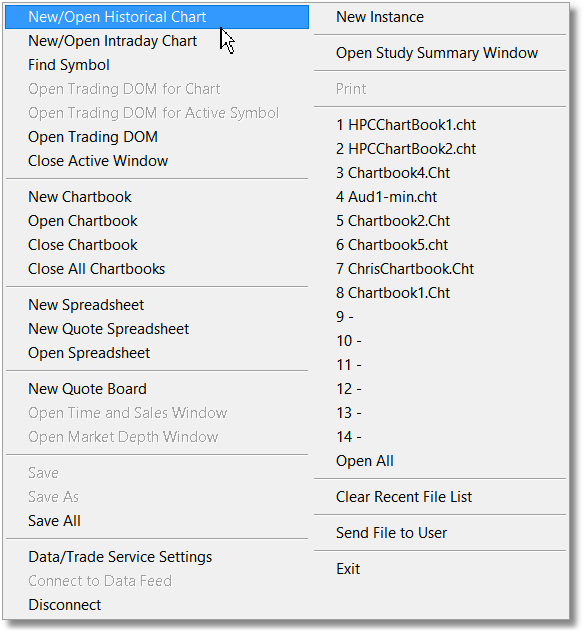
•Select the File option from the main menu again and this time select the New/Open Historical Chart option from the drop-down menu.
|
|
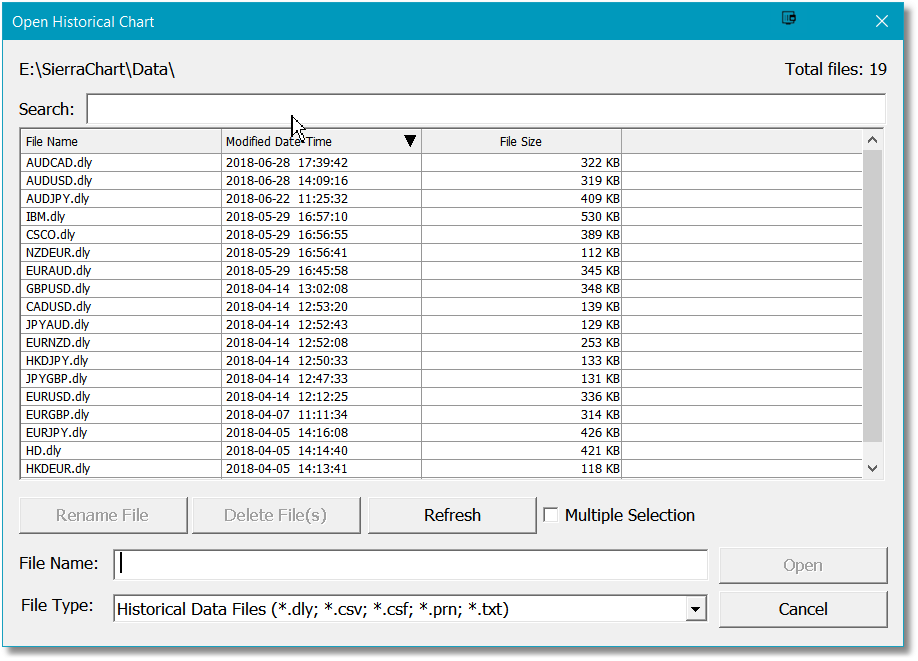
•The Open Historical Chart dialog will be displayed.
•Select a symbol from the list or alternatively type in a new symbol name in the Search field.
•Click on the Open button at bottom-right. |
|
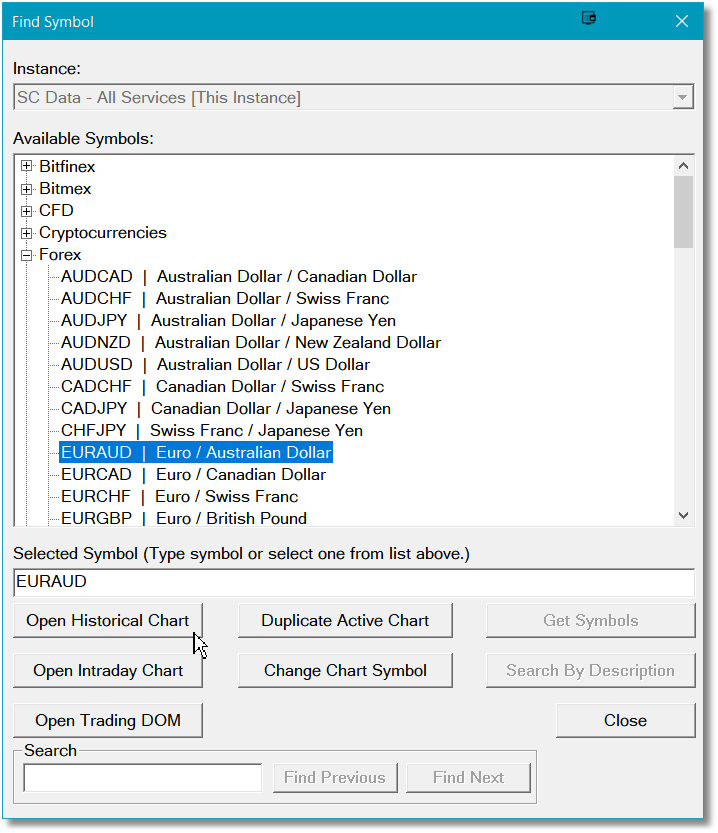
•If no symbols are present in the Open Historical Chart dialog, close the dialog, select the File option from the main menu and then select the Find Symbol option.
•In the Find Symbol dialog, select a symbol from the Available Symbols list and then select the Open Historical Chart option. |
|
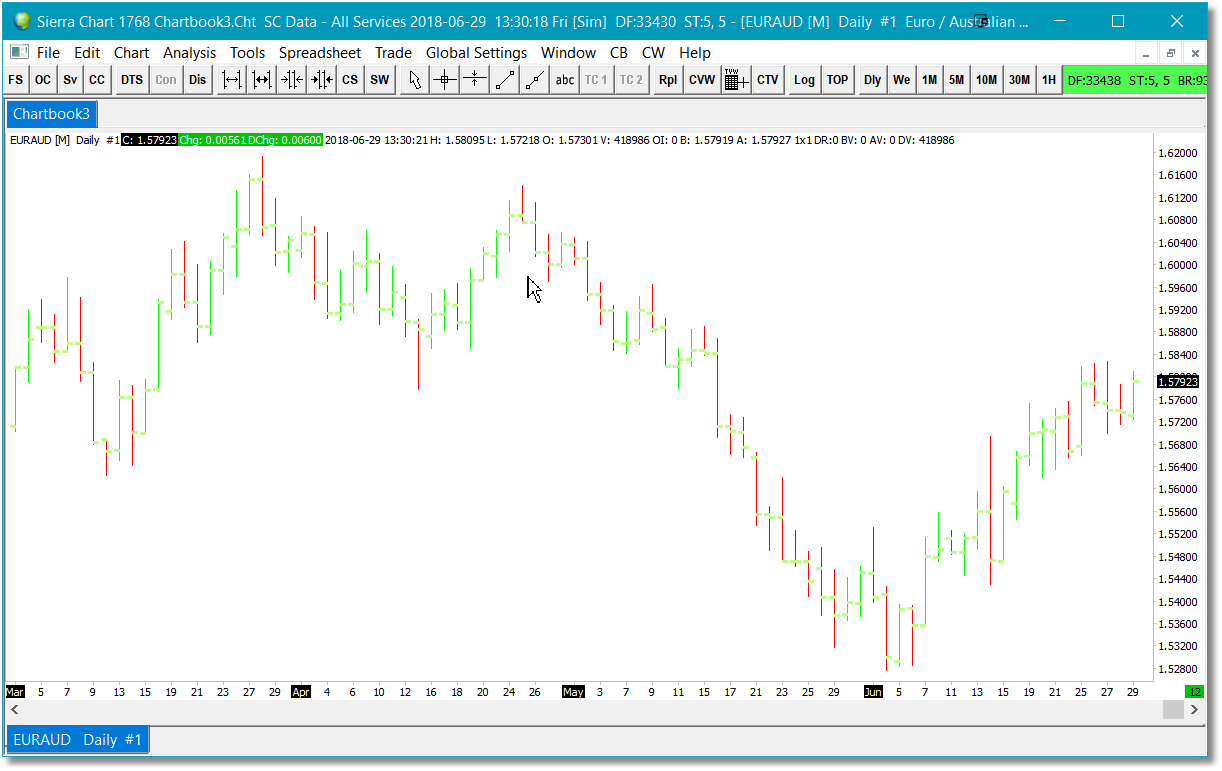
•Your chart will now be displayed. |
|
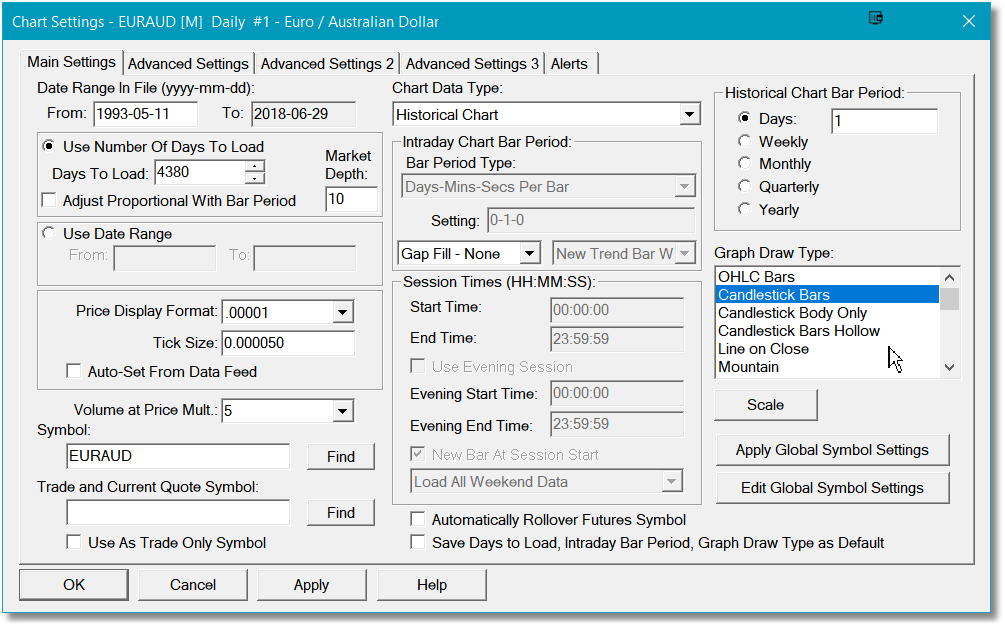
•To adjust the basic chart settings, select the Chart option off of the main menu, then select the Chart Settings option from the drop-down menu.
•In the Chart Settings dialog you can adjust a large number of data and cosmetic features. Refer to the Sierra Chart documentation for more information on all of the available options.
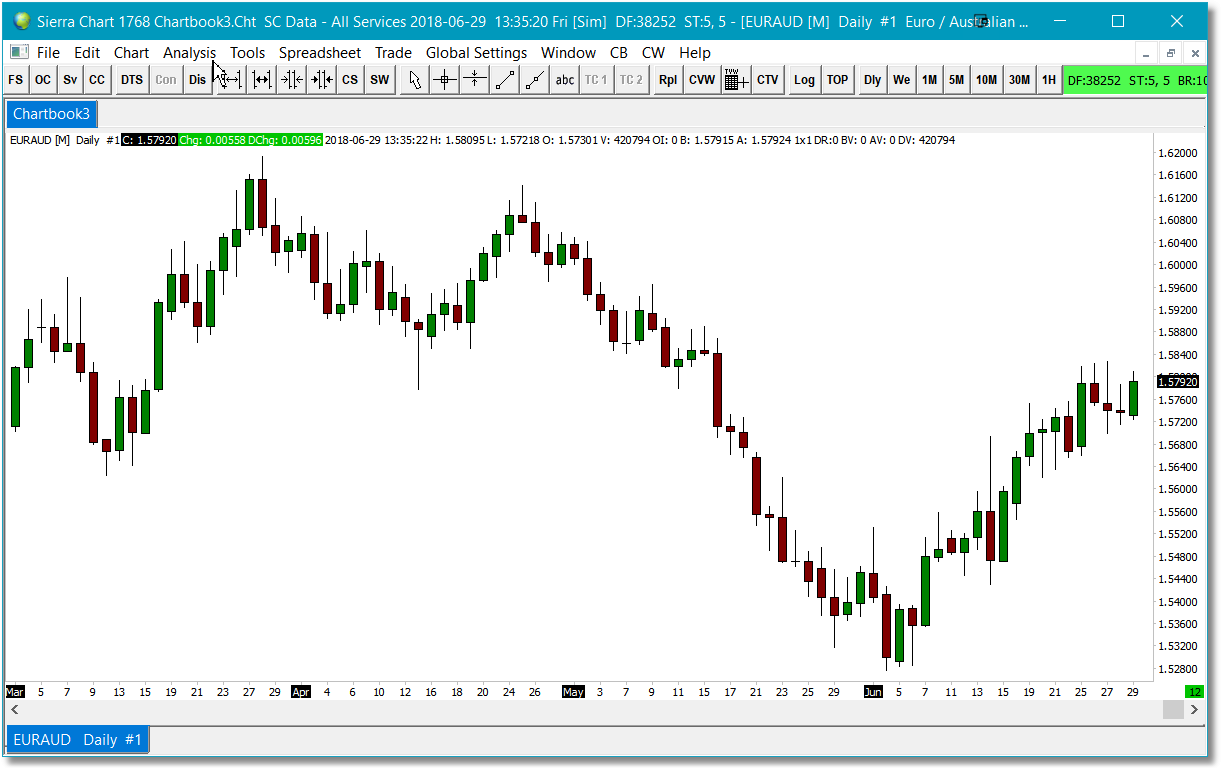
•In our case, we will select Candlestick Bars from the Graph Draw Type option on the left.
•Click on the Ok button when done and you will be returned to the chart. • |
|
•Back in the chart, select the Analysis option off of the main menu.
•Select Studies from the drop-down menu.
|
|
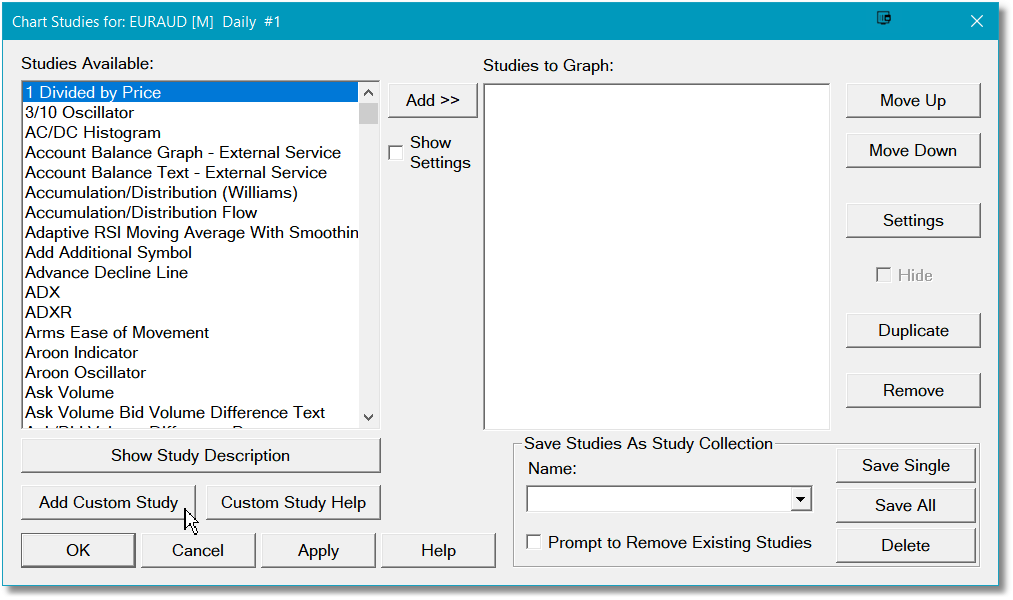
•In the Chart Studies dialog, click on the Add Custom Study button near the bottom-left of the dialog. |
|
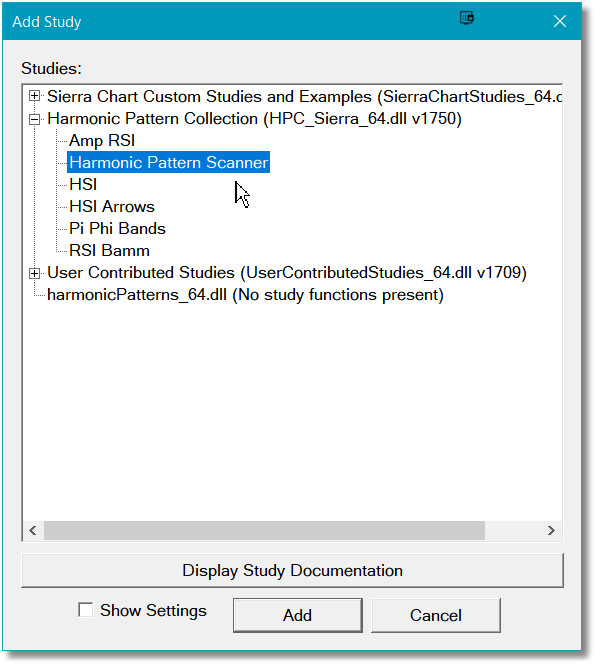
•The Add Study dialog will now be displayed.
•Look for Harmonic Pattern Collection in the list of available studies, and click on the (+) to the left of it to expand the indicator list.
•Click on the Harmonic Pattern Scanner indicator in the list, and then click on the Add button at the bottom of the dialog.
|
|
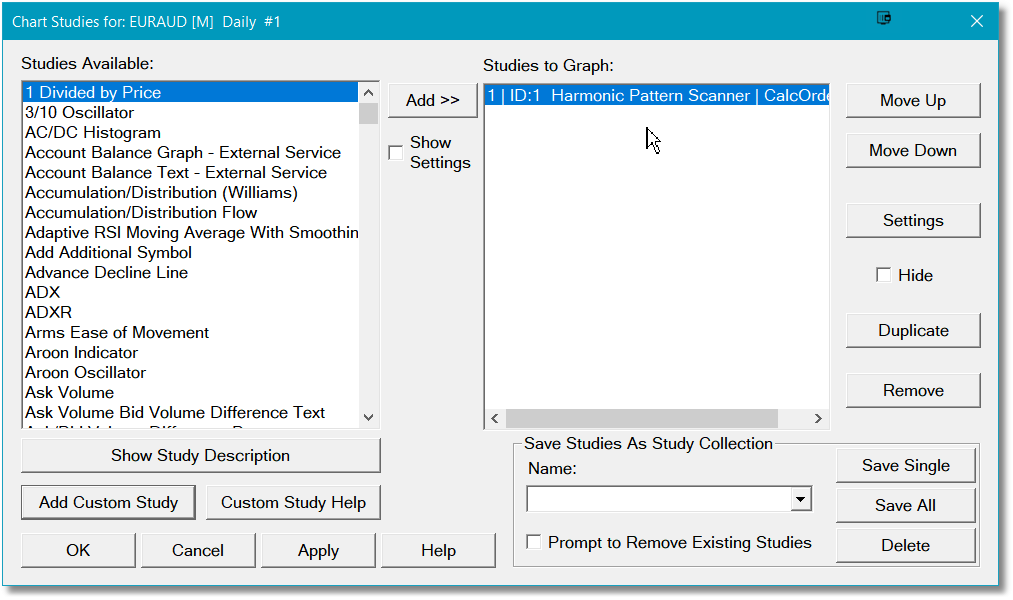
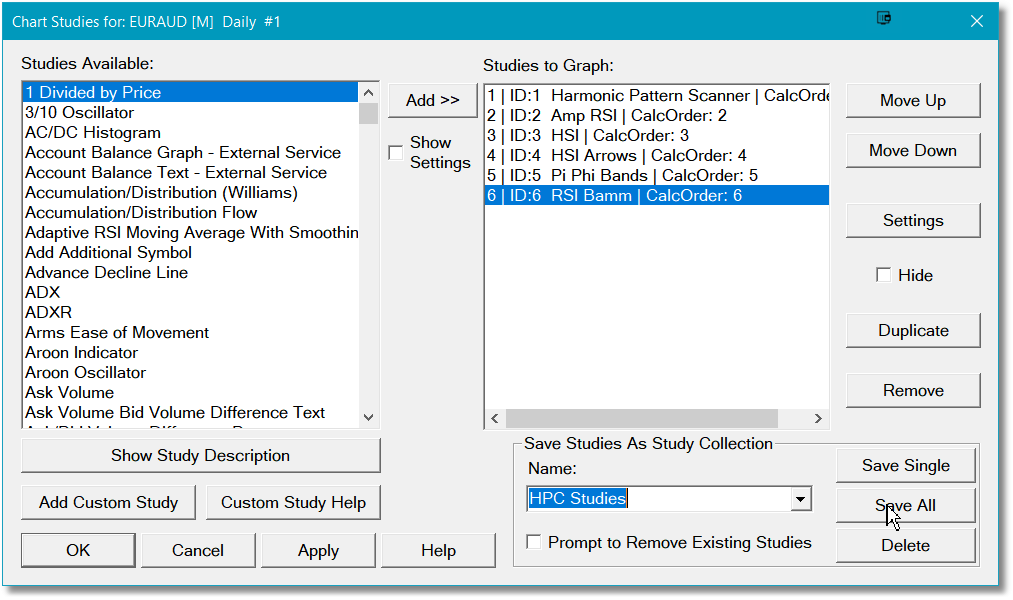
•You will now be back in the Chart Studies dialog.
•You will see the the Harmonic Pattern Scanner indicator has been added into the Studies to Graph section of the dialog.
•Repeat the steps above to add the remaining HPC indicators into the Studies to Graph section.
|
|
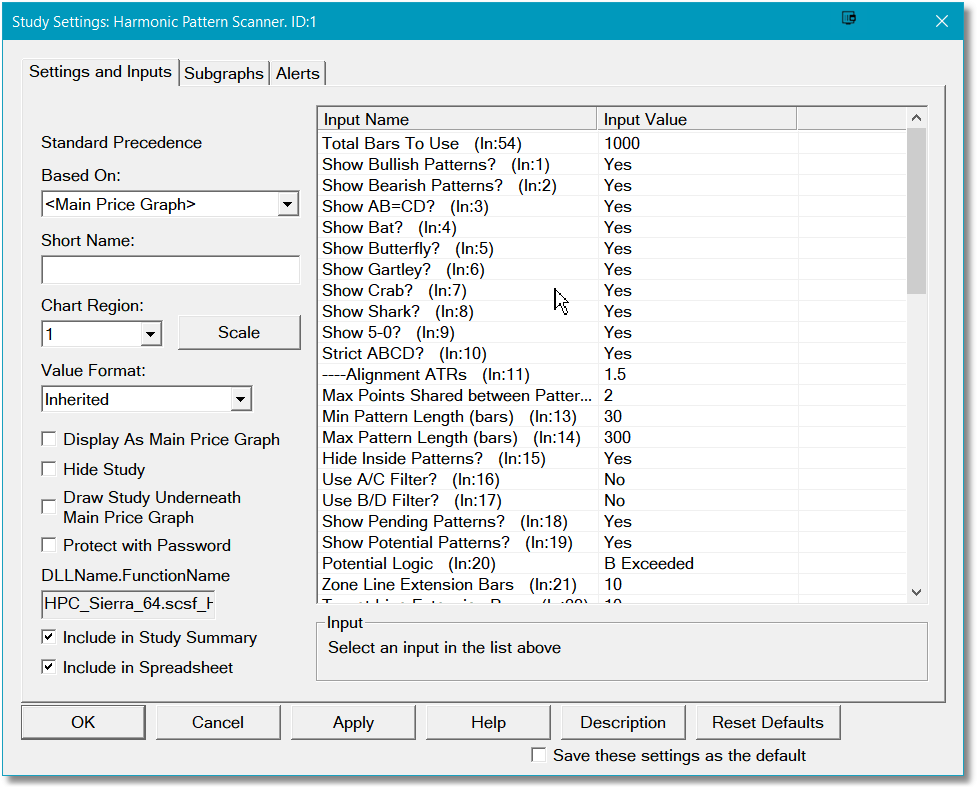
•You can adjust the settings for any of the indicators in the Studies to Graph section by clicking on the Settings button that you will see on the right-hand side of the dialog.
•This will pull up the Settings dialog for the selected indicator.
|
|
•Once you have added all of the studies you wish to use into the Studies to Graph section and you have completed all of your settings changes, type in a name for this group of studies in the Save Studies as Study Collection field.
•Now click on the Save All button.
•You will be prompted to confirm that you wish to save all studies into a group using the name you have typed in. Click on the Yes button.
•Now, click on the OK button at bottom-left of the Chart Studies dialog and you will be returned to your chart.
|
|
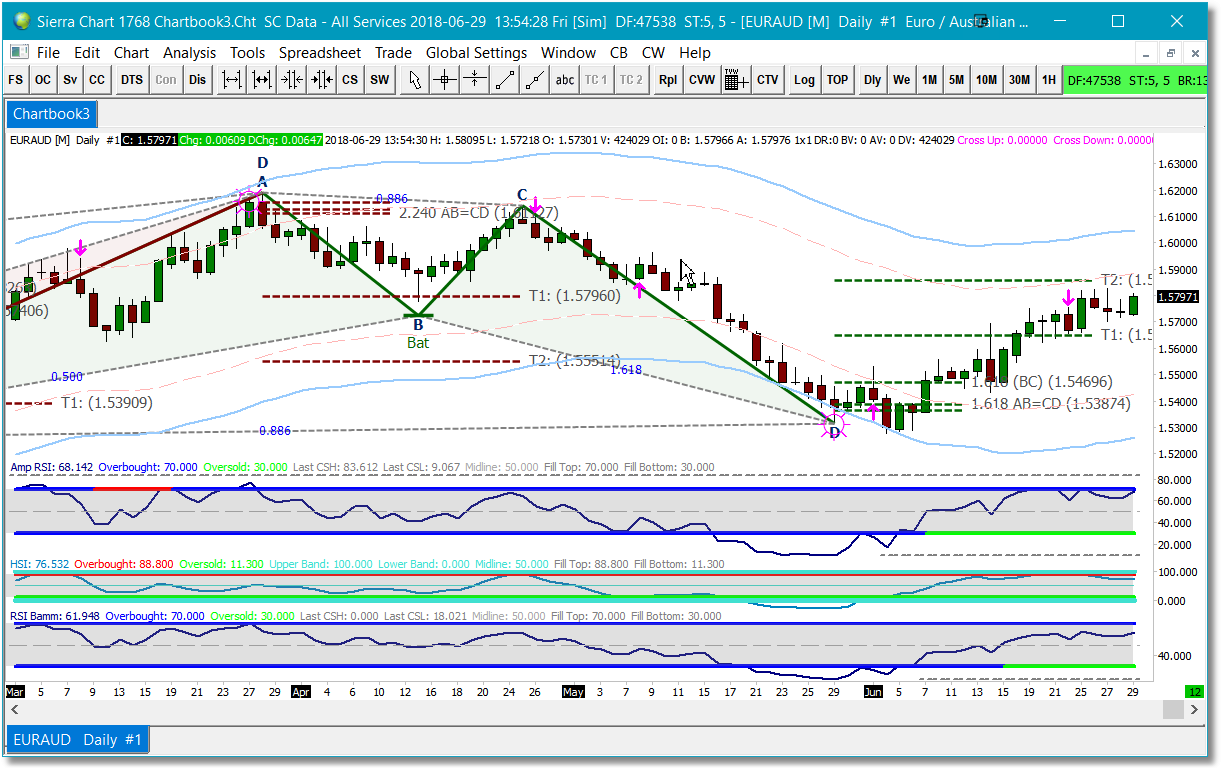
•Your ChartBook will now be comprised of one chart, and this chart will have all of the selected indicators loaded. |
|
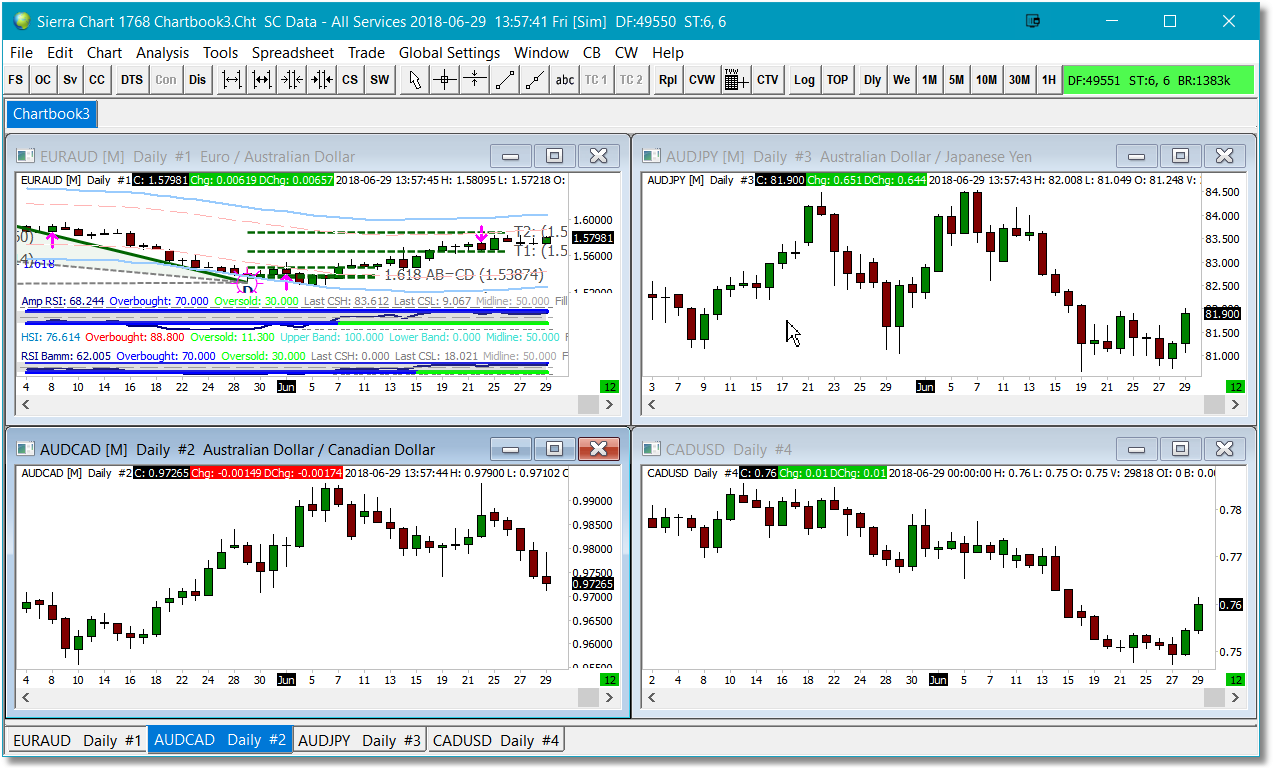
•Now, follow the initial steps at the top of this list to open as many additional charts as you wish to include in this ChartBook.
•In our example, we have loaded 3 additional charts and, currently, the HPC indicators are only loaded into one of these charts. |
|
To add the indicators to the remaining charts:
•Click inside of a chart to select it;
•Select the Analysis option from the main menu and then click on the Study Collection name that you created in an earlier step. All Study Collection presets should be listed at the bottom of the Analysis menu.
•This will load all of the indicators into the selected chart.
•Repeat this process for each chart in your ChartBook. |
|
•Once you have your ChartBook set up exactly the way you want it, select the File option from the main menu and then select the Save As option from the drop-down.
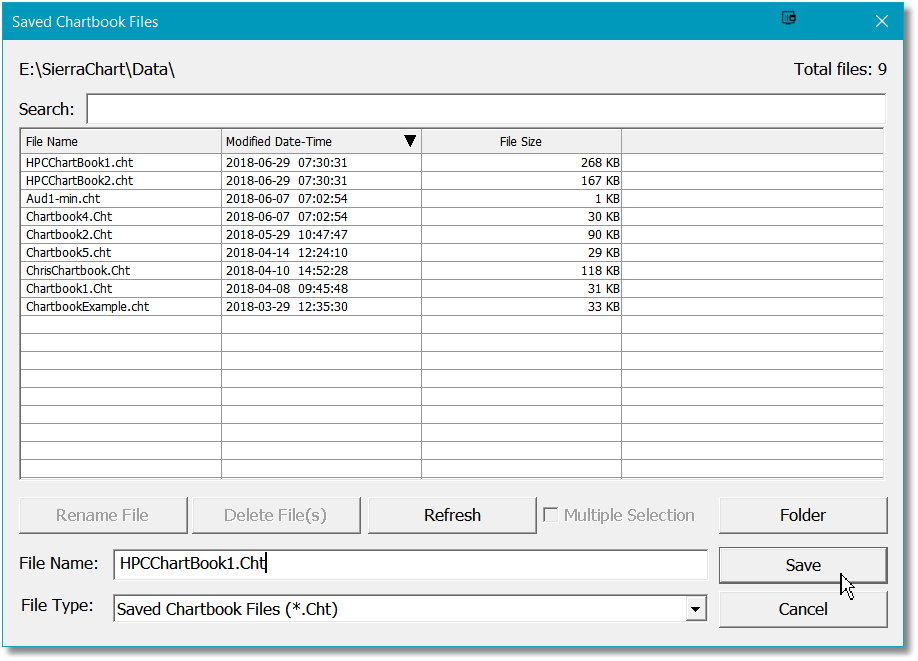
•The Saved Chartbook Files dialog will be displayed.
•Type in a new name for your ChartBook (or accept the default name) and click on the Save button. |
|
•You have now successfully created your first ChartBook.
•Repeat the steps above to create as many ChartBooks as you need. |
|

Open the Study Summary Dialog
•Follow the steps in the previous section to create and configure all of your ChartBooks if you have not already done so.
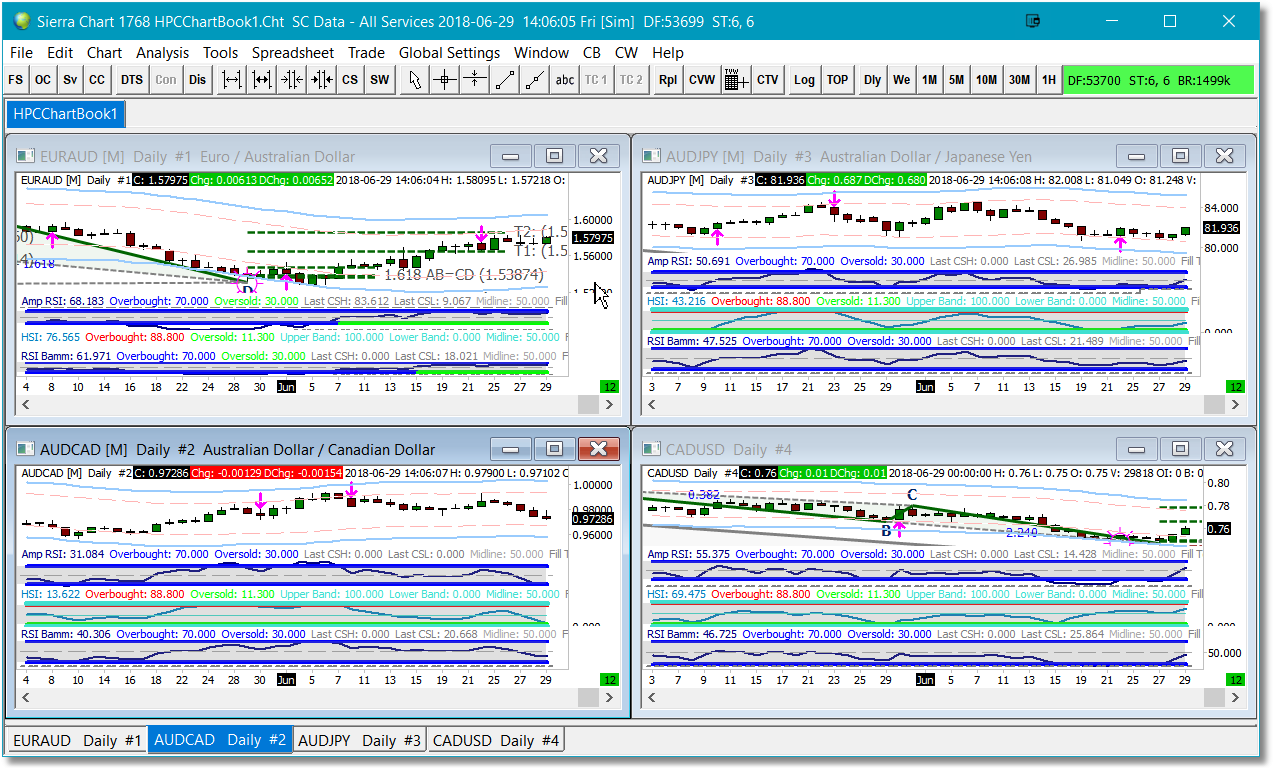
•In our example, we have created 2 ChartBooks and each ChartBook contains 4 charts. Again, this is just an example...you may have many more ChartBooks and each ChartBook may be comprised of more than 4 charts.
|
|
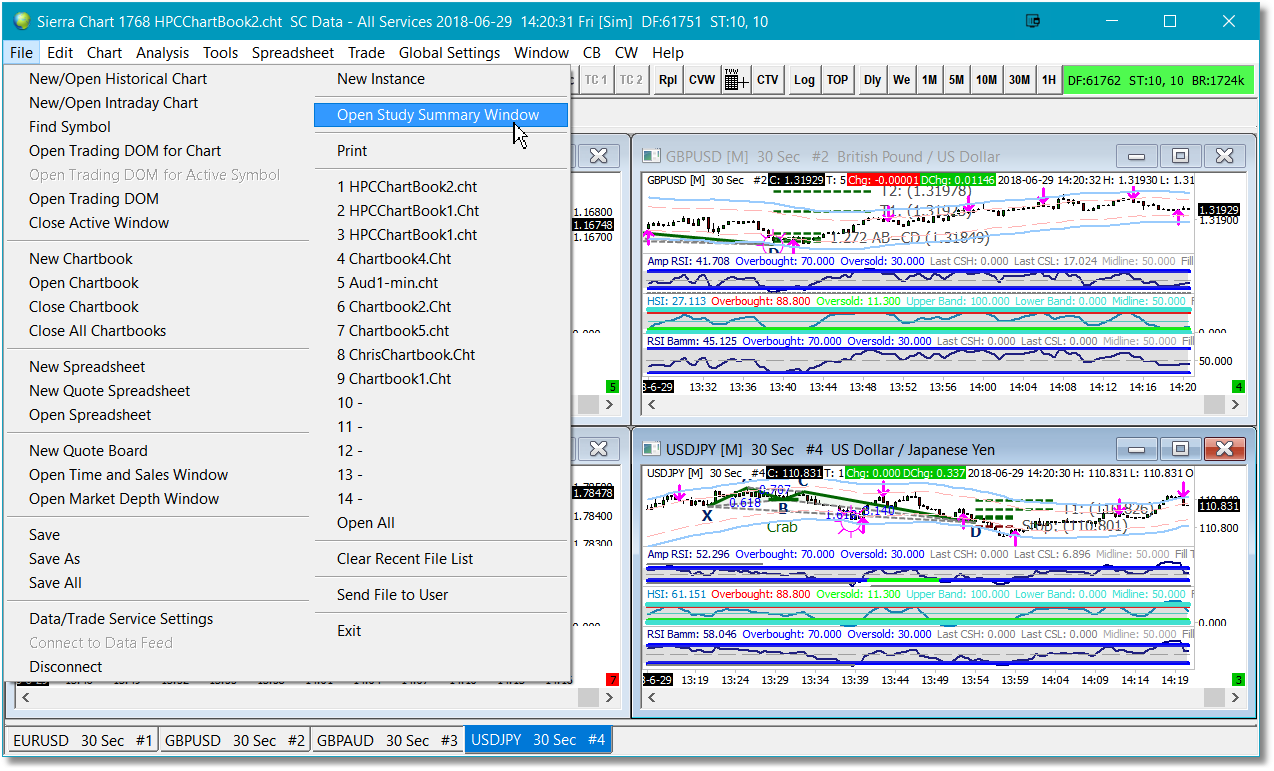
•To open the Study Summary dialog, select the File option from the main menu, then select the Open Study Summary Window from the drop-down menu.. |
|
•The Study Summary dialog should appear over your ChartBook and it will probably look something like what you see in the snapshot to the right.
|
 |
Some of the Study Summary dialog settings will require adjustment on first use:
•By default, the Study Summary dialog will be displaying information for ALL indicators loaded into all charts that have the Study Summary option selected. To view the HPC Pattern summary, use the scrollbar at the bottom of the dialog to shift left or right until you see the Status, Potential, Pattern, Bars, Stop, T1, and T2 columns..
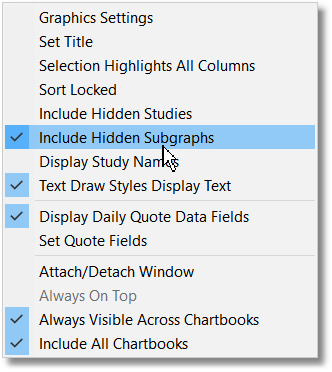
•Click on the Settings option at top-left of the Study Summary dialog.
•In the drop-down menu, make sure the following options are checked:
•Include Hidden Subgraphs •Text Draw Styles Display Text •Display Daily Quote Data Fields •Always Visible Across Chartbooks •Include All Chartbooks.
|
|
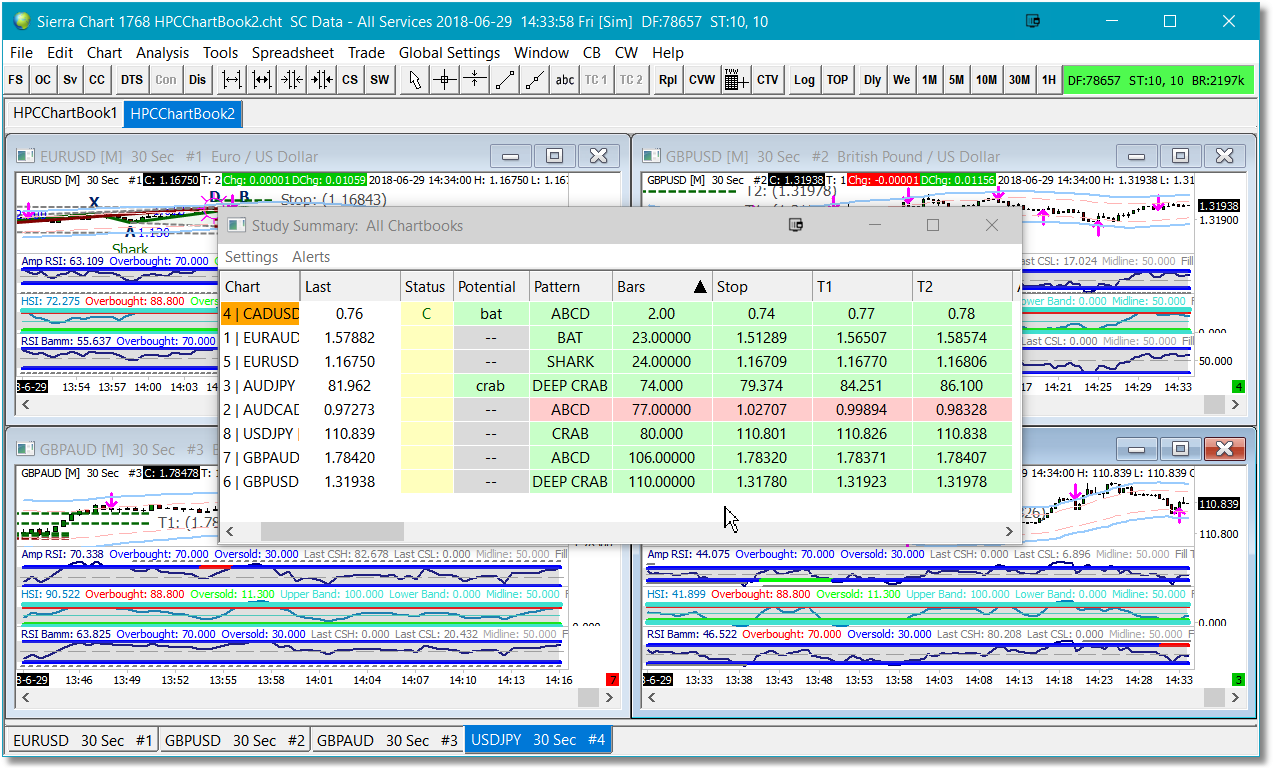
•Once you have the Study Summary dialog configured correctly, it should look something like our example on the right.
•There should be a row for all of your charts in all of your ChartBooks.
•Click on the Bars column to sort the list in ascending order. This will keep the newer patterns at the top of the list. |
|

See Also:
