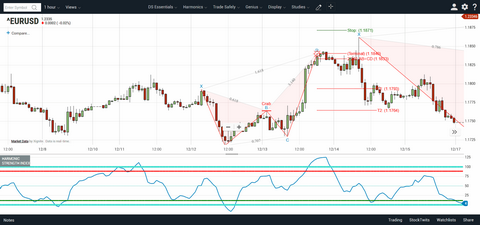
The Harmonic Strength Index (HSI) is a newly-developed oscillator that seeks to optimize the signaling properties identified in RSI by Scott Carney for the methodology of harmonic trading. Co-developed by Scott Carney and Keegan McClellan, it represents a new perspective on Wilder’s original work. Its principal uses lie in the confirmation of harmonic patterns, assistance in entry point identification, measurement and monitoring of trend segments and identification of trend integrity, identification of key inflection points in price and as a tool for position management. It is designed to replace RSI for harmonic traders.
The traditional RSI indicator, in its default form as developed by Welles Wilder, exhibits a number of distinct signals as defined by Scott Carney in The Harmonic Trader: Volume II and in his webinar recordings. Far from only displaying the basic entry signals the indicator is most commonly portrayed with, RSI's readings can be categorized into a variety of distinct formations which can serve the sophisticated user of RSI well in the process of making deductions about the market's behavior. HSI was developed with these signals in mind for the purpose of optimizing them for the use of harmonic pattern analysis. While RSI can go for a relatively long time without displaying an extreme reading or otherwise giving any clear signal, HSI was developed with the intention to consistently and rapidly identify potential inflection points in price, resulting in decisive signals that make it an ideal tool for identifying high-probability profit-targets as well as for consistently finding harmonic entries in rapidly-moving markets.
|
Note: HSI will operate with standard price bars, Heikin-Ashi bars, and Range bars. It will NOT produce a plot if Kagi, Line Break, Point & Figure, or Renko are selected as the bar type. |
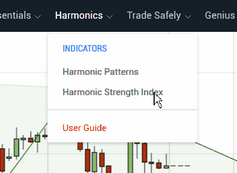
•To load the HSI indicator, click on the Harmonics menu option and select Harmonic Strength Index from the drop-down menu and the indicator will be loaded into your chart.
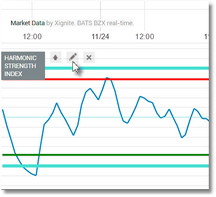
•Once the indicator has been loaded, you can access the parameters dialog at any time by clicking on the pencil icon that appears just to the right of the indicator name. To remove the indicator, click on the (x) button.
See Also:


