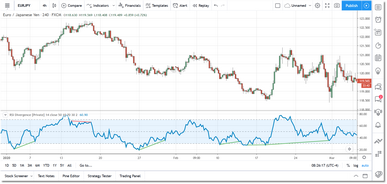
Once you have purchased a license for one or more of the divergence indicators and submitted your TradingView username, the indicator should appear in the Invite-Only Scripts section of your Indicators dialog in TradingView. Just click on the indicator and it will be loaded into your chart.
As mentioned in the Introduction, the divergence indicators will identify both bullish and bearish divergences (you can toggle either on/off via the Settings dialog). In addition to identifying new divergences, the indicators will also extend existing divergences when necessary.
The indicators also include various settings that can be used to filter divergences by location as well as by size.
Oversold/Overbought
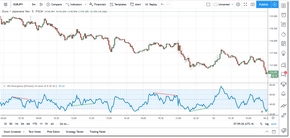
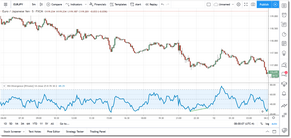
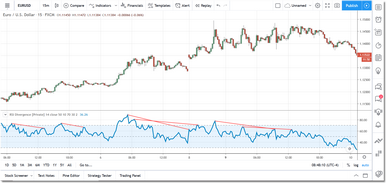
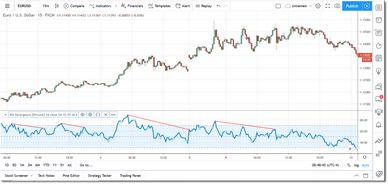
The Require OS/OB? setting allows you to filter out all divergences that do not occur in either oversold or overbought territory. The idea being that a divergence that occurs in extreme territory is likely to be a stronger signal, and this is often the case. In the chart above on the left the Require OS/OB? setting is unchecked (turned off) while in the chart on the right it is turned on...and you can see that a number of divergences were filtered out.
You can define what is considered Oversold and Overbought by adjusting the Upper Ref and Lower Ref fields in the Settings dialog. For the RSI Divergence Indicator examples above, we have defined Oversold as any reading below 30 and Overbought as any reading above 70.
The best way to determine if this filter will be beneficial is to take a quick look at the recent historical data and see if those divergences occurring in oversold/overbought territory are currently performing better than all of the other divergences.
You do need to be cautious if the security is currently in a strong trend since, in those situations, you will likely get a number of false signals. During a strong trend, most oscillators will show a oversold or overbought condition for an extended period of time. So, again, the best way to get a feel for how divergence signals are working for a particular security and timeframe is to look at the recent divergence signals on the chart and evaluate their performance.
To be fair, though, a divergence signal during a trend does indicate a loss of momentum, but it does not necessarily indicate a reversal of momentum. In these situations it is best to wait for other signs that the trend is nearing an end (i.e., double-top/bottom, head-and-shoulders, etc.) before you pay closer attention to any divergence signals.
Minimum Divergence Length
Divergences come in all sizes and, depending upon your trading style, you may prefer to filter out very small divergence signals. You can use the Minimum Divergence Length and Pivot Lookback settings to accomplish this.
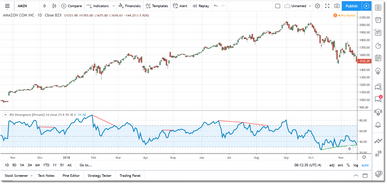
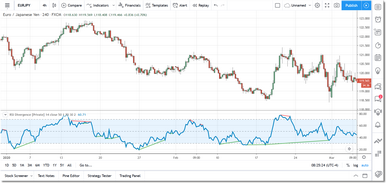
In the charts above you can see the difference in the size of divergence signals generated. In the chart on the left we are using a Minimum Divergence Length setting of 1 while on the chart on the right we are using a setting of 10, which is the default. Typically it is advantageous to filter out the very small divergence signals since their overall impact is minimal in terms of price movement. However, if you are scalping then working with the smaller signals may provide an edge.
Overlapping Divergences
The Allow Overlapping Divergence Sets? setting is more of a cosmetic feature and it serves to reduce clutter when a number of divergences occur in sequential fashion (e.g., when a security is trending).
Alerts
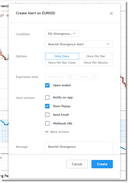
All of the divergence indicators will generate an alert condition in TradingView whenever a new divergence is found, or an existing divergence is extended. A separate alert condition will be generated for bullish and bearish divergences. You can create/configure an alert by clicking on the Alert button that you see at the top of your TradingView charts.
In the Condition field, click on the down-arrow and select the divergence indicator for which you wish to receive alerts. You can then adjust the remaining options based on the alerts you want to receive.
See Also:
