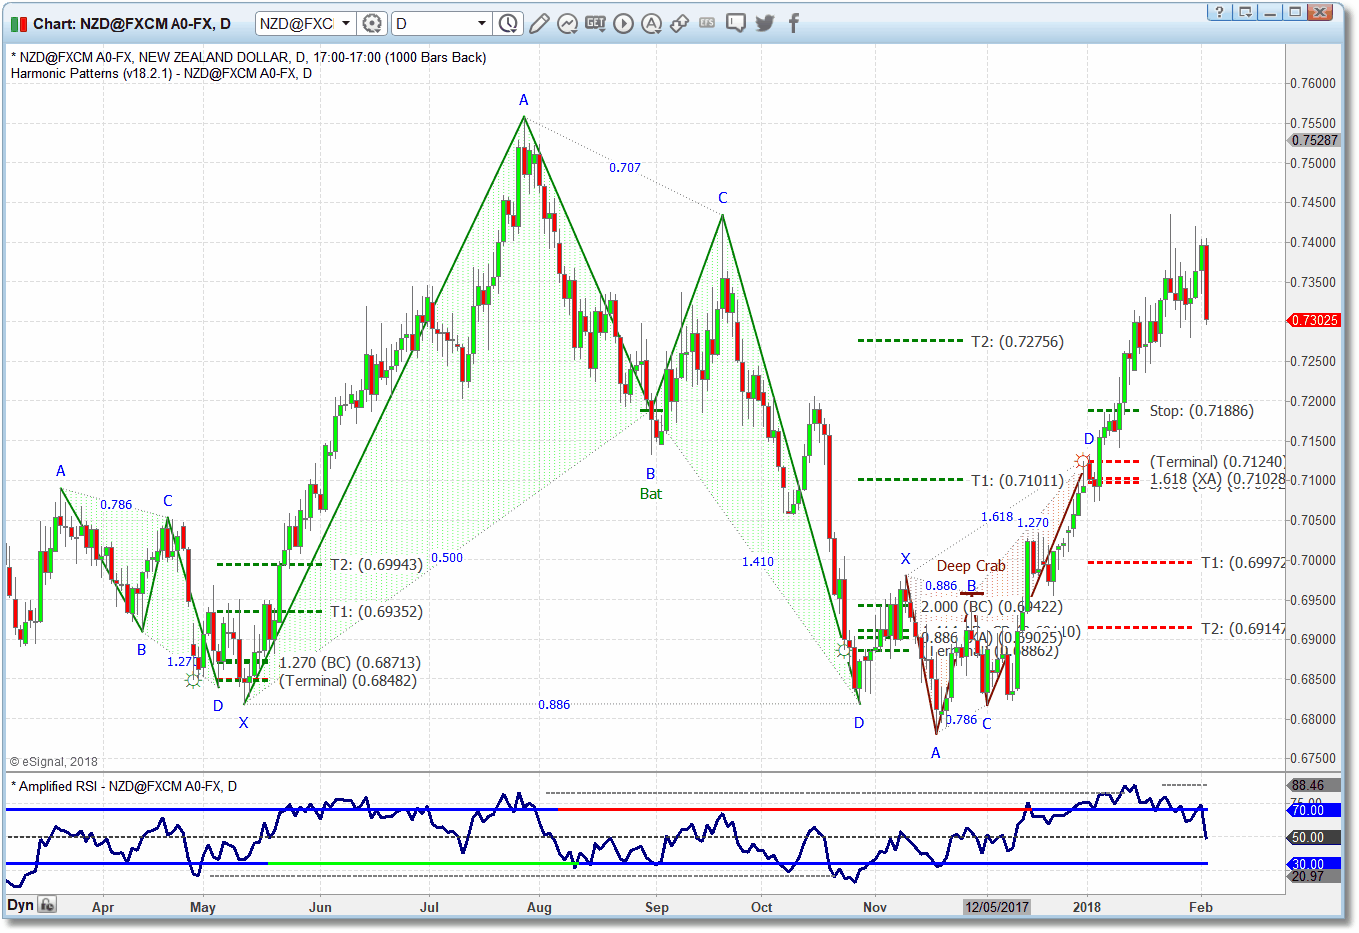
Amplified RSI is a precursor to HSI that was developed with the purpose of optimizing RSI's oscillation to the most suitable frequency for trading with the patterns.
While more prone to extended divergences than HSI, Amplified RSI nevertheless has remained on our charts for its unique ability to signal frequent complex structures along with the accompanying market expectations that this provides us. It also has the advantage of not requiring as much historical chart data to be loaded on the chart in order to display the indicator (only thirteen bars as opposed to approximately five hundred bars of data in HSI's case.)
|
Note: The Amplified RSI indicator can also be used in a watchlist. |
To load the Amplified RSI indicator into a chart:
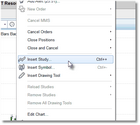
•Right-click in your chart and select the Insert Study option from the pop-up menu.
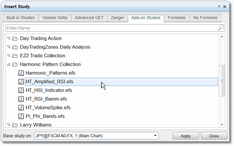
•The Insert Study dialog will be displayed. Click on the Add-on Studies tab.
•Then scroll down until you find the Harmonic Pattern Collection folder. Double-click on the folder to open it. Then click on the HT_Amplified_RSI.efs indicator to select it, click on the Apply button, and then click on the Close button to close the dialog.The indicator will now be loaded in your chart.
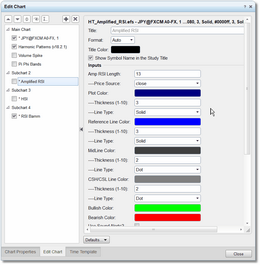
•Once the indicator has been loaded into a chart, you can access the parameters dialog by by right-clicking in the indicator pane of the chart and selecting the Edit Chart option from the pop-up menu. The parameters dialog (called Edit Chart) will be displayed:
•Make your edits/changes and then click on the Close button at the bottom-right of the dialog to close the parameters dialog and return to the chart. See the Settings section for a complete description of all of the available parameters.
See Also:


