Developed by Scott Carney, the Amplified RSI indicator (ampRSI) is based upon of the original Relative Strength Index equation by Wells Wilder in his book, New Concepts in Technical Trading Systems (1978). Over the past decade, Carney has refined the indicator to express extreme readings as well as differentiate specific indicator formations that distinguish unique market environments. Although the “amplification” of RSI integrates proprietary (and private) harmonic ratio measures with the original indicator formula as defined by Wilder (14-period standard), the result is more than a “harmonic multiplication” of original RSI.
Amplified RSI generates clearer extreme readings that provide enhanced detail of the “internal strength” of the price action, especially at the completion of harmonic patterns. The AmplifiedRSI is an indicator that generally ranges between 0-100. These extremes are defined by the standard levels of Overbought above 70 and Oversold below 30. The key challenge is to monitor a price response following a pattern completion relative to the extreme ampRSI indicator reading.
Amplified RSI can reverse quickly from an extreme as an early and leading indicator of what is about to unfold. Therefore, the harmonic pattern opportunities that work best typically possess clear ampRSI indicator reversal confirmation unfolding before price. The indicator also includes proprietary ampRSI Confirmation/Divergence highlights where two critical tests of the indicator mark an important potential turning point at the extreme level. Again, these strategies work best in the confirmation of harmonic pattern opportunities but provide a unique manner to exhibit Relative Strength relationships, as well.
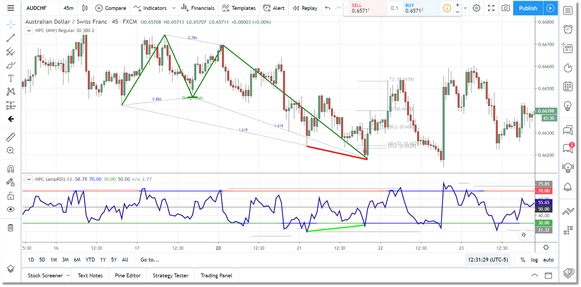
Checking for divergence between ampRSI and the price action can be a powerful confirmation tool when evaluating patterns. In the example above we have drawn a red line connecting two recent pivot lows in the price data and a green line connecting those same two lows in the ampRSI, and the ampRSI is indicating a bullish divergence right at the D point of the Deep Crab pattern.
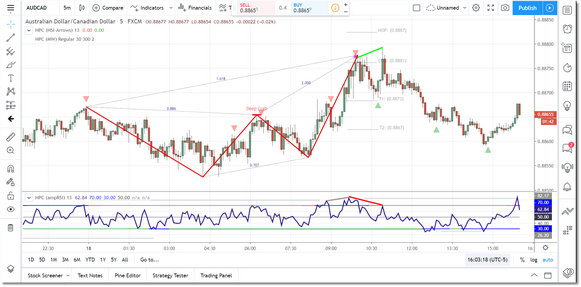
Above we have an example of bearish divergence in the ampRSI. While there was no clear divergence at the Deep Crab pattern D point, after a brief move down there was a retest of the XA level and here we get a strong divergence. The divergence may not always occur at pattern termination, sometimes it will trigger a few bars later so it pays to be patient and pay attention.
Note that HSI can also be used for divergence-checking but the ampRSI tends to be a bit clearer in that regard.


