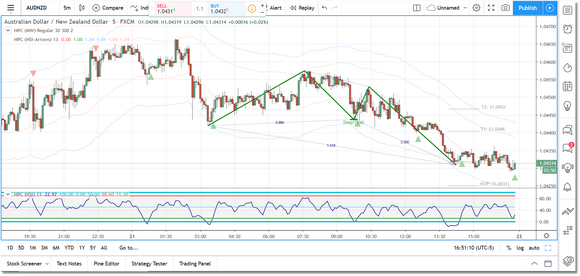
This indicator contains both the HSI Arrows and Pi Phi Bands logic. You can toggle either plot on/off via the indicators Settings dialog.
HSI Arrows is the companion to the HSI indicator and it runs in the price pane. HSI Arrows will display an up-arrow below each bar where HSI crosses up through the lower threshold and a down-arrow above each bar where HSI crosses down through the upper threshold.
|
Note: The HSI indicator can require a large number of price bars to prime the calculation. For securities and/or bar intervals that do not have a lot of historical bars it is possible that the HSI (and HSI Arrows) will not be able to render a plot. |
The Pi Phi Bands identify the “harmonic range” in which price is oscillating, creating a simple way to identify when price is trending into extreme territory. Although a touch of a band does not necessarily indicate exhaustion in price, it is a good place to start looking.
The most reliable signal we have found in Pi Phi Bands is to look for price to hug one band for an extended period of time and then to anticipate a quick reaction off of the opposing band when price finally connects with it. For instance, if price hugs the upper band for several days on the fifteen minute chart, we would look for price to react quickly when it finally touches down to the lower band. An extended return to an indecisive range in the middle of the bandwidth would negate this signal.
See Also:


