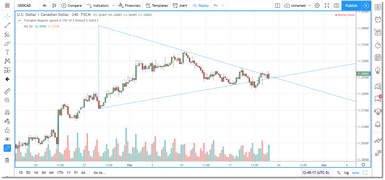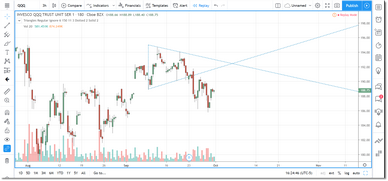
Once you have purchased a license for the Triangle Pattern for TradingView indicator and submitted your TradingView username, the indicator should appear in the Invite-Only Scripts section of your Indicators dialog in TradingView. Just click on the indicator and it will be loaded into your chart.
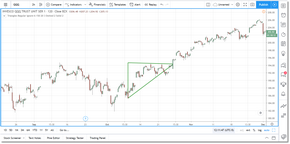
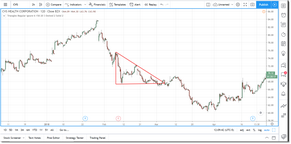
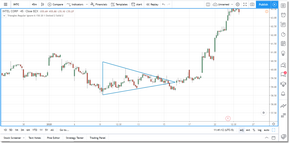
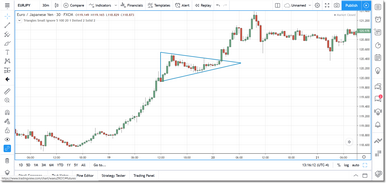
As mentioned in the Introduction, the indicator will identify three different variations of the Triangle consolidation pattern (click to enlarge):
•Ascending Triangles (drawn in green) have a near-horizontal top line and typically indicate consolidation that will break to the upside.
•Descending Triangles (drawn in red) have a near-horizontal bottom line and typically indicate consolidation that will break to the downside.
•Common Triangles (drawn in blue) are more symmetrical and can break to the upside or the downside. Typically, though, they will break in the direction of the prior trend.
You can fine-tune the identification logic associated with these pattern types by adjusting the Min Bars Remaining, Max Triangle Length, Endpoint Location Tolerance, and Ascending/Descending Price Tolerance options in the Settings dialog. You can also adjust the overall size of the Triangle patterns identified by adjusting the Triangle Size option.
Pending vs Confirmed
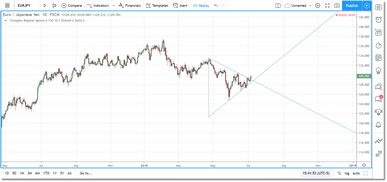
When a new Triangle pattern is found it is considered to be a Pending triangle because the endpoint of the triangle is still a point in the future.
Pending triangle patterns are drawn with dotted lines and the lines extend into the future. Once the triangle endpoint is reached, the triangle is considered to be Confirmed and it will be redrawn with solid blue lines that do not extend past the endpoint.
Usage
Not all Triangle patterns found by the indicator will be good candidates for trading, so you will need to evaluate each pattern as it nears completion to see if it meets some basic criteria:
•Basic Shape - For an Ascending or Descending triangle you want the upper/lower line to be nearly horizontal. For a Common triangle you want the pattern to be as symmetrical as possible with the endpoint of the triangle as close to the middle of the pattern as possible.
•Price Action - You want to look for triangles where the price action remains inside of the triangle frame for as long as possible, and fills the triangle as much as possible. Many triangles will fail early when price moves out of the triangle well before the endpoint. As a rule of thumb, you want the price action to remain inside of the triangle until the last quarter in terms of the length of the triangle.
•Diminishing Volume - A valid triangle is a consolidation pattern and, as such, you want to see diminishing volume over the lifetime of the triangle. Flat or irregular volume is generally Ok as well, but you don't want to see increasing volume until the actual breakout.
•Prior Trend - The easiest triangles to trade are those that appear during a strong trend, as in our Confirmed Triangle example above. So price makes a strong move in one direction or the other, then price consolidates for a period of time, and then (typically) the trend resumes. This consolidation often takes the form of a triangle.
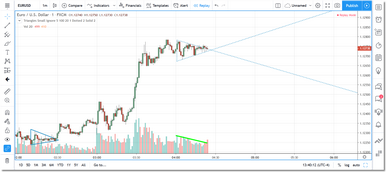
As an example, the Pending triangle below would be a good candidate since we have a prior up-trend, diminishing volume, and a nice tight 'coil' pattern in the triangle. In this case we would expect a breakout above on higher volume (click to enlarge):
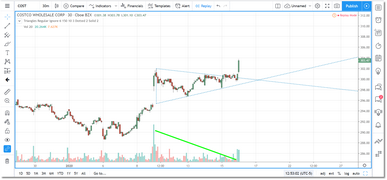
The Pending triangle below would also be considered a good candidate (click to enlarge):
As you can see, the price action remains within the frame of the triangle (highs/lows that peek through are not a problem) almost to the endpoint and we have diminishing volume which is a clear sign of consolidation. The breakout does not occur until we are well into the final quarter of the triangle and it occurs on higher volume. This is exactly what we are looking for.
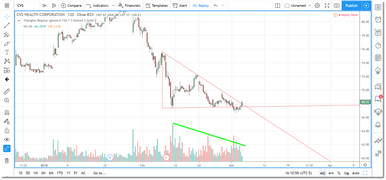
Here is another example of a good Pending triangle pattern, this time a Descending triangle (click to enlarge):
This one checks all of the boxes in that we have diminishing volume, a prior down-trend, the price action fills the triangle shape nicely, and price has made it well into the final quarter of the triangle.
|
Note: Ascending and Descending triangles in particular will often head-fake in the wrong direction before actually breaking out in the expected direction. So, for a Descending triangle you should expect a small bullish breakout before price moves to the downside and, vice-versa for an Ascending triangle. |
This next example is a triangle that we would probably avoid (click to enlarge):
While we do have diminishing volume, which is important, the price action does not really 'fill' the triangle...it is more of a slow swing rather than a true triangle consolidation pattern. You want to see a tight coil forming within the triangle frame.
In the snapshot above we have another Pending triangle that probably should be avoided. We don't really see any clear diminishing volume over the life of the pattern and price breaks out of the pattern outline much too early. As mentioned above, we do not want to see a breakout until at least the last quarter of the pattern.
Targets and Stops
The price target for a well-formed Triangle pattern will be the breakout price plus or minus the height of the pattern. So if a pattern breaks out to the upside, you would add the height of the pattern to the close of the breakout bar and that would be your price target.
The stop for a Common triangle can be quite tight..typically just on the other side of the triangle from the breakout. A good choice would be to use the most recent swing low as the stop for a bullish breakout, and the most recent swing high for a bearish breakout. For the Ascending or Descending triangle there will often be a move in the 'wrong' direction first, and then price will break in the expected direction. For these triangles it is best to give them time to develop and wait for confirmation of a price move in the expected direction on higher volume. At that point you can just trail a stop.
Alerts
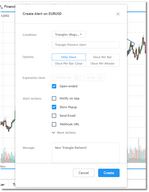
The indicator will generate an alert condition in TradingView whenever a new triangle pattern is found. You can create/configure an alert by clicking on the Alert button that you see at the top of your TradingView charts.
In the Condition field, click on the down-arrow and select the Triangles indicator. You can then adjust the remaining options based on the alerts you want to receive.
See Also:
