cycleAnalyzer (Goertzel) for TradingView uses digital signal processing (DSP) techniques to extract the three strongest cycles from the price data, and it plots these cycles in the indicator pane in the correct phase and relative amplitude, or you can display a composite plot. Both of these options provide a very graphical view of a security's cyclical behavior. You can also display the full power spectrum based on all cycles in the data.
Depending upon the symbol/interval you are charting the recent cyclical activity may be obvious, but most of the time the cyclical characteristics of a security are not very clear to the naked eye. In these situations cycleAnalyzer functions to strip out the noise and expose the underlying structure of the price action.
Keep in mind, cycles are not magic, and cycles do NOT move price. Rather it is the other way around...cycles are simply an imprint of the natural order, the buying and selling that is occurring in the security. Buyers drive the price up, and sellers drive the price down. This is occurring constantly and over different spans of time. Economic reports, news events, and even tweets can abruptly impact the price action of any security. But the majority of the time a security will travel in a somewhat constant and recurring path and, by applying cycle analysis, we can remove all of the noise and distraction and view the underlying "waves" inherent in the price action.
Cycles can and do change, and sometimes frequently. However there are also long stretches of time where they remain relatively intact. And if you have a clear understanding of how price has moved recently you can make an educated guess as to how price will move in the near future. Also, if you understand the cyclical behavior of a security then it puts the odds in your favor since you will know immediately if the security is transitioning to a new cyclical footprint. What looks random to others will actually make sense to you since you have a basic roadmap of how the price action should unfold barring any outside influences (i.e., news, economic events, etc.).
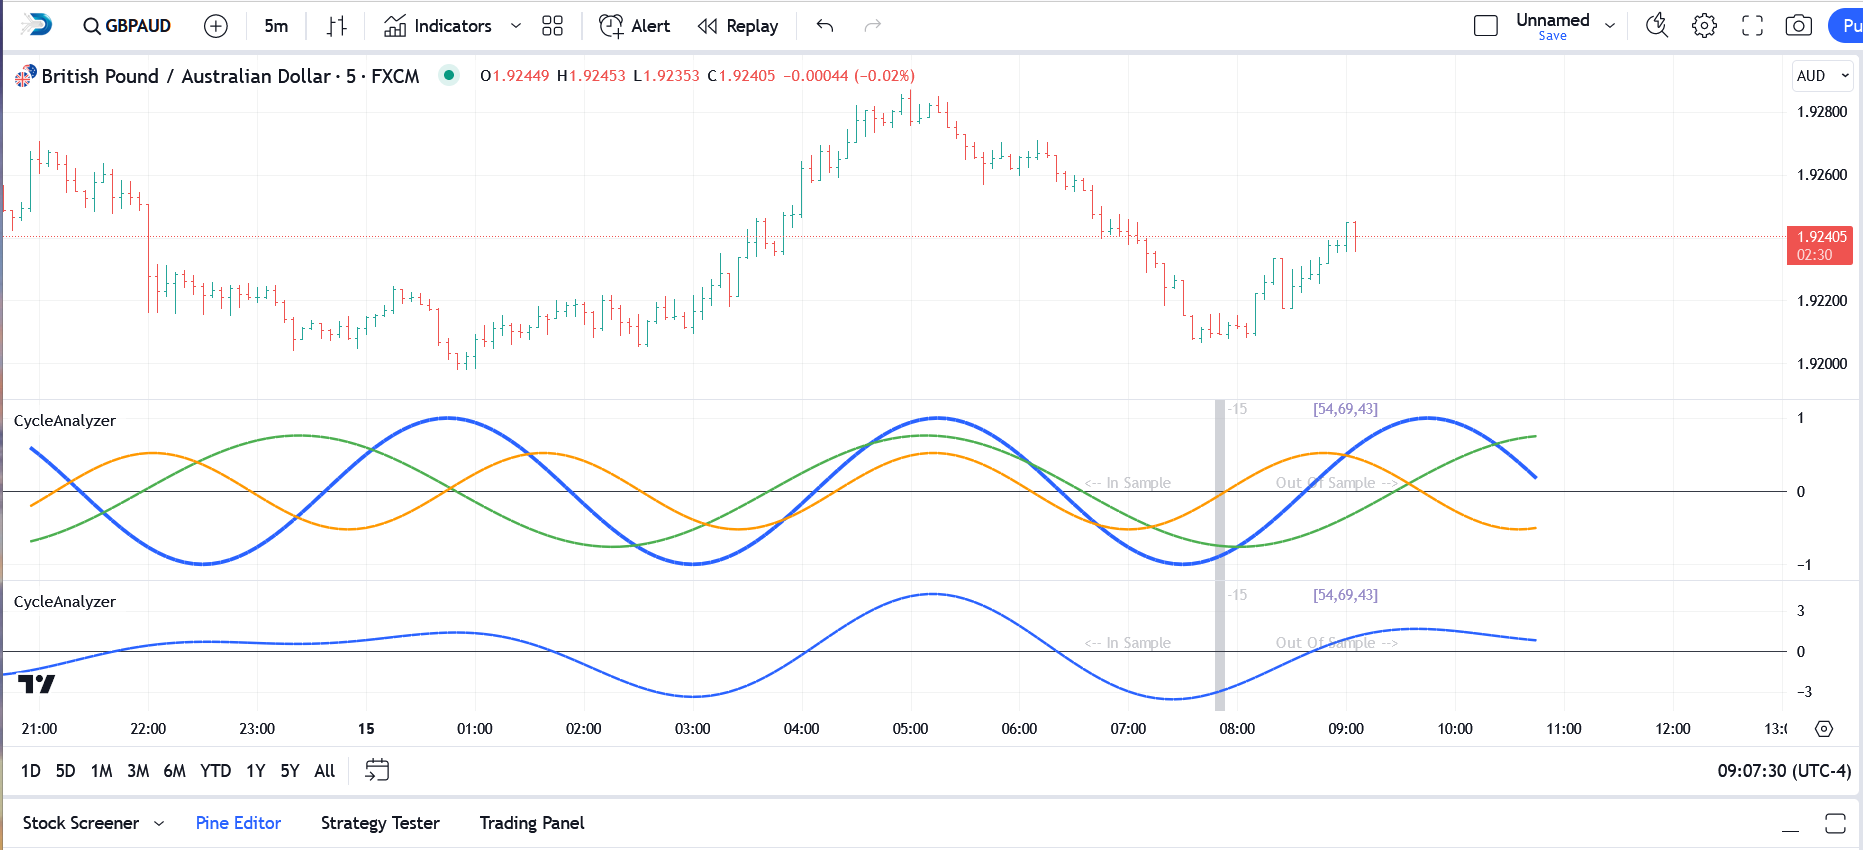
In the chart above we have loaded two copies of the indicator just to illustrate the plots that are available (click to enlarge):
•In the upper pane we are displaying the three strongest cycles (as listed in the label that you see to the right of the silver vertical bar-offset line). The cycles are presented as sine waves and are displayed in the correct phase and relative amplitude. This plot allows you to examine the cycles individually.
•In the lower pane we are displaying a composite of the same three cycles. Essentially we sum the three individual cycles, taking into account their phase and relative amplitude, and create a filtered proxy for the price action. This can give you a clearer indication of how price will behave if the current cycles remain intact.
Please refer to the Overview topic for instructions on how to load and use the cycleAnalyzer indicator in TradingView.
|
Note: In the documentation that follows all images/thumbnails are "clickable". So if a particular image is too small for you to see clearly, just click on it and a larger version will be displayed. You can adjust the font size and/or print individual sections of this documentation by clicking on the () icon that you see at the top-right of every page. Keyword index and topic search features are available as well. Just click on the tabs that you see above the table of contents that is displayed to the left. While best viewed in a desktop browser, this documentation is in a responsive format and can also be viewed on phones and tablets. |

If you have comments, questions, or suggestions on how we can improve our product, please send an email to support@sr-analyst.com and reference cycleAnalyzer for TradingView in the subject line.