divergence software, inc.
Development & Consulting Services
Product Detail
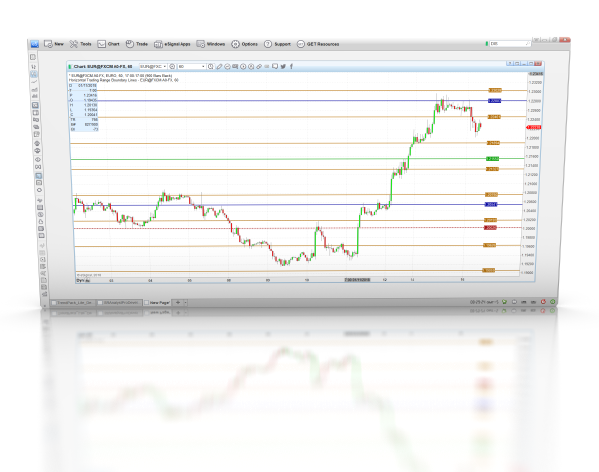
HTR Boundary Lines
TradingView indicators will be activated for your TradingView account and no installation is required. eSignal indicators will be delivered to you via email in zip files. Some of the more complex indicators have installer programs. In most cases we will require your eSignal username so that we can set up the entitlement for the indicator(s) you have purchased.
The majority of our indicators are licensed for a one-time fee (i.e., non-recurring). However, we do have some subscription-based products, including marketDirection Monitor, Harmonic Pattern Collection, and S/R Analyst Pro.
Description
Featured on TFNN.com by Steve Rhodes. The formula is a complex Support and Resistance indicator that identifies the horizontal trading range boundary lines (or HTR lines) based on the two most common collocated price levels of the open and close prices.
By default the indicator displays the HTRs based on the Monthly interval. The formula may be applied to any chart interval and can display HTR lines for Monthly, Weekly, Daily, and/or intraday intervals simultaneously. The intraday HTRs can only be displayed on intraday chart intervals, however. The distance between the two primary HTR levels reliably identifies the typical amount of price movement that occurs before a market runs into the next area of significant support or resistance. This price distance is projected above and below the primary range to be used for analyzing the future price behavior. HTR lines that appear above price represent resistance and the HTR lines below price represent areas of support. This indicator can be an excellent complement for any trading strategy by providing additional confirmations to your strategies trade signals.
Specifications
- Product ID: SEN05
- Study only, no source code provided
- Requires eSignal 12.x or newer