divergence software, inc.
Development & Consulting Services
Product Detail
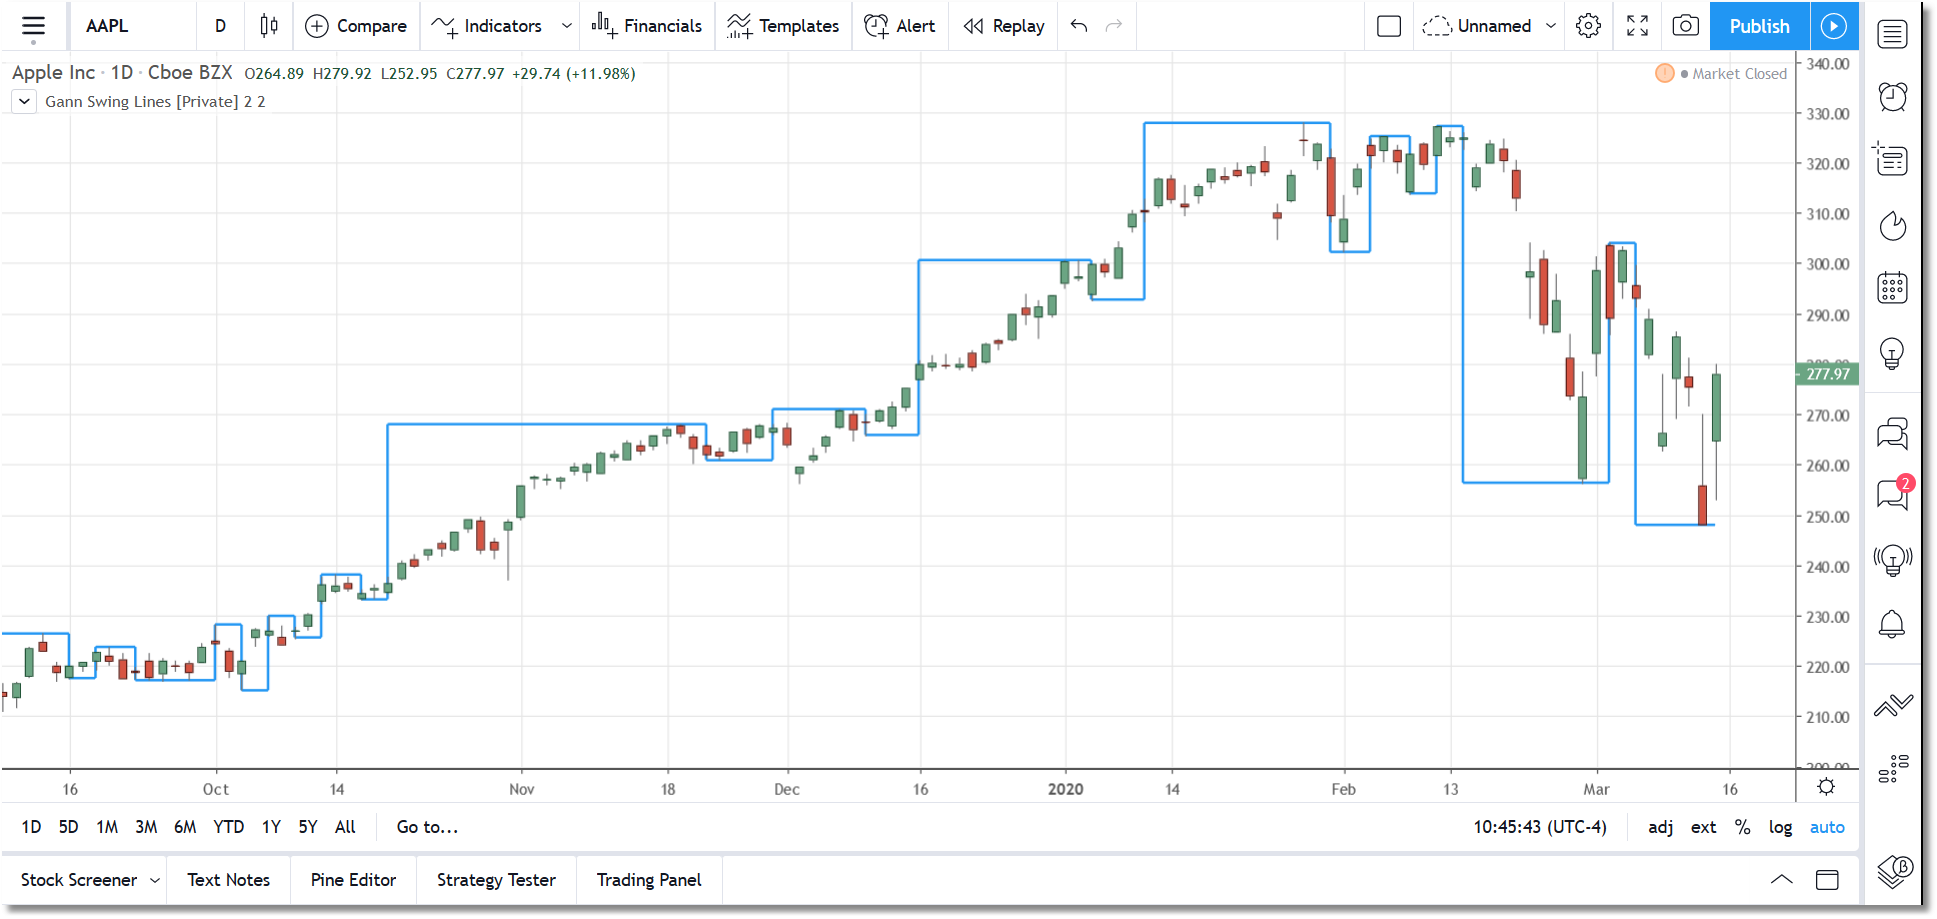
Gann Swing Lines for TradingView
TradingView indicators will be activated for your TradingView account and no installation is required. eSignal indicators will be delivered to you via email in zip files. Some of the more complex indicators have installer programs. In most cases we will require your eSignal username so that we can set up the entitlement for the indicator(s) you have purchased.
The majority of our indicators are licensed for a one-time fee (i.e., non-recurring). However, we do have some subscription-based products, including marketDirection Monitor, Harmonic Pattern Collection, and S/R Analyst Pro.
Description
The Gann Swing Lines indicator is a correct implementation of the classic Gann Swing Chart for the TradingView platform. You can adjust the swing period from 1 to 50 bars (the default is 2) and you can also select whether or not to include outside bars in the calculation. The Manhattan Chart display makes it easy to visualize the swings and also to objectively determine the current trend.
A series of lower Ganns Swing highs and lows indicate a down trend, and a series of higher Gann Swing highs and lows indicate an up trend. Periods of alternating Gann Swing highs and lows indicate consolidation. In addition to trend determination, prior Gann Swing levels are often important support and resistance levels.
We are limited in TradingView to the total number of line objects that we can draw on a chart at any given time and that number is currently around 50. If you use a small Gann Swing period then the historical plot will be limited.
Specifications
- Product ID: TV0009
- Study only, no source code provided
- Requires TradingView