divergence software, inc.
Development & Consulting Services
Product Detail
Multi-Timeframe Hi/Lo Levels for TradingView
TradingView indicators will be activated for your TradingView account and no installation is required. eSignal indicators will be delivered to you via email in zip files. Some of the more complex indicators have installer programs. In most cases we will require your eSignal username so that we can set up the entitlement for the indicator(s) you have purchased.
The majority of our indicators are licensed for a one-time fee (i.e., non-recurring). However, we do have some subscription-based products, including marketDirection Monitor, Harmonic Pattern Collection, and S/R Analyst Pro.
Description
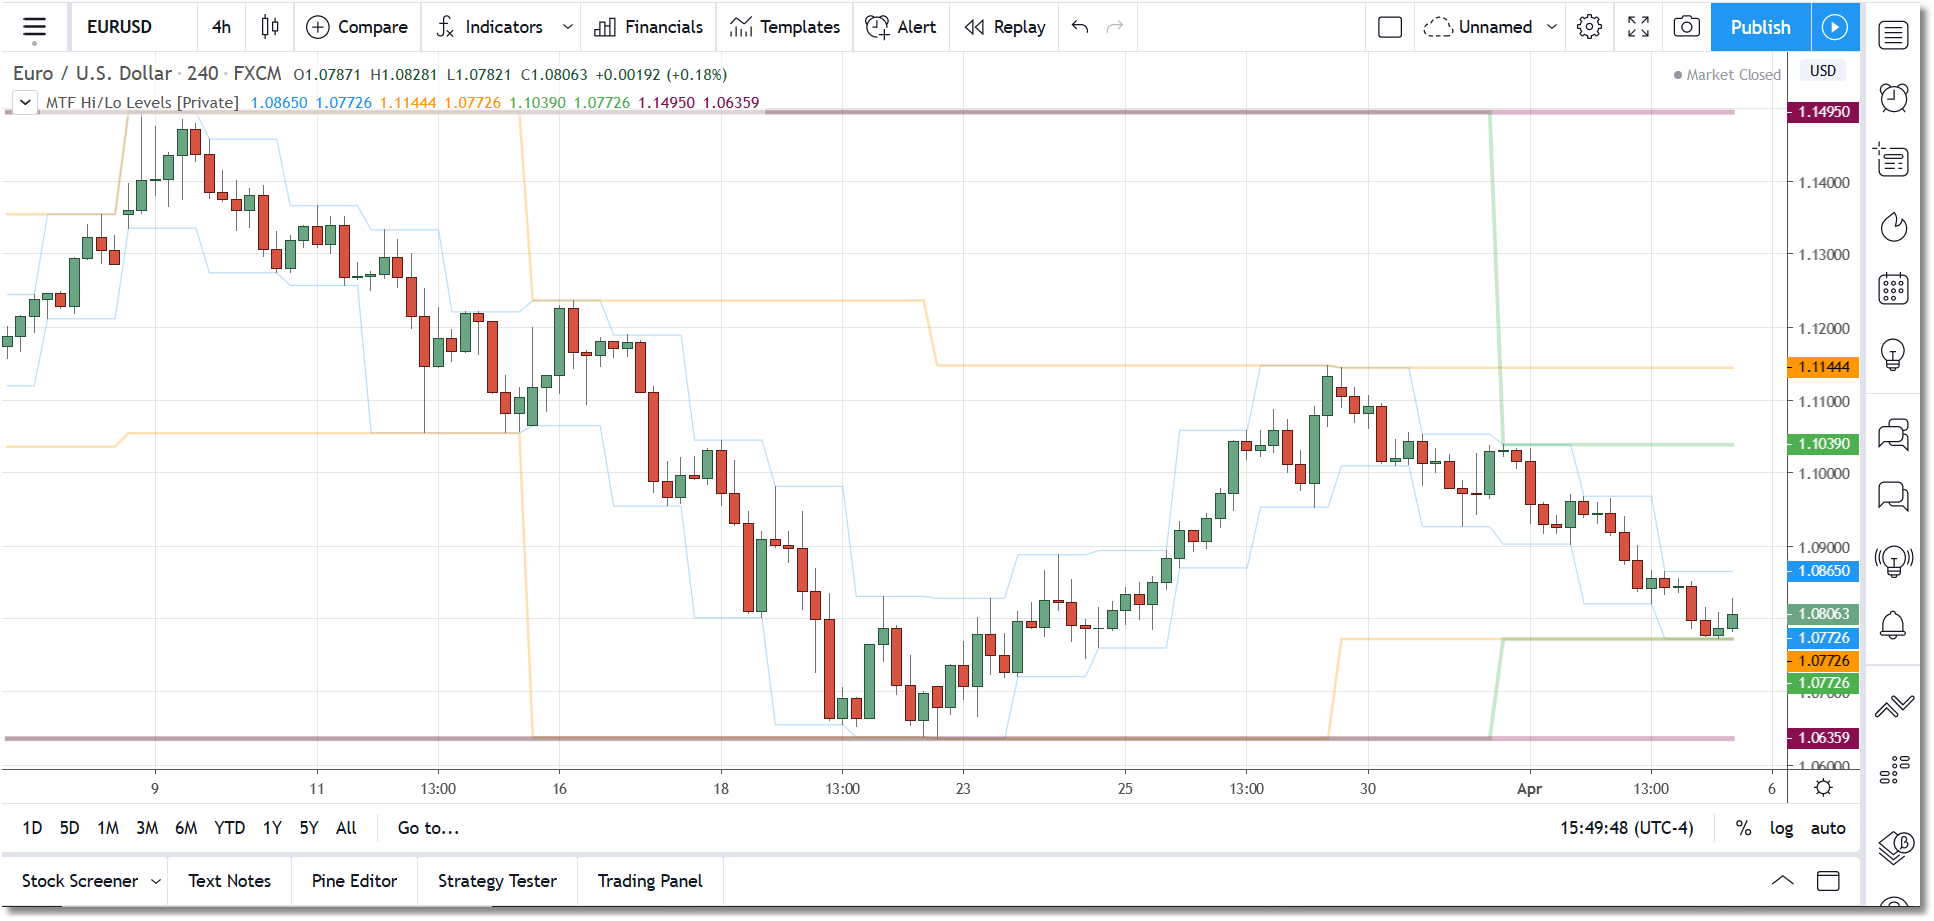
The Multi-Timeframe Hi/Lo Levels indicator for TradingView automatically tracks the Daily, Weekly, Monthly, and Yearly high and low levels and plots them on your chart. This allows to you instantly see where current price is relative to these levels.
You can toggle each timeframe on and off individually or you can allow the indicator to determine when a particular level should be plotted. You can adjust the line colors, thickness, and transparency in the Style section of the Settings dialog. By default we have the lines plotted using relatively high transparency so that they do not distract from the chart action.
It is recommended that you set your TradingView chart scale to Scale Price Chart Only when you use this indicator.
Specifications
- Product ID: TV0014
- Study only, no source code provided
- Requires TradingView