The Chart Interface
|
Note: S/R Analyst Pro is intended to be used in both a watchlist and a chart simultaneously, with the watchlist linked to the chart. If you choose to only use the chart component (i.e., not linked to any watchlist) keep in mind that the Activity Monitor feature in the chart will be disabled since the recent activity calculation is handled exclusively by the S/R Analyst Pro watchlist component. |
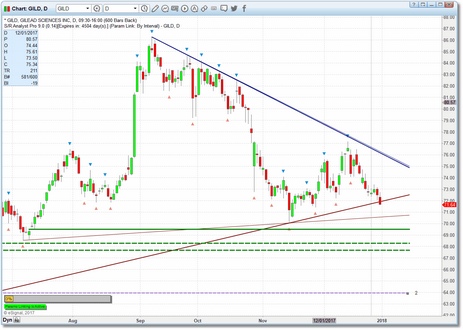
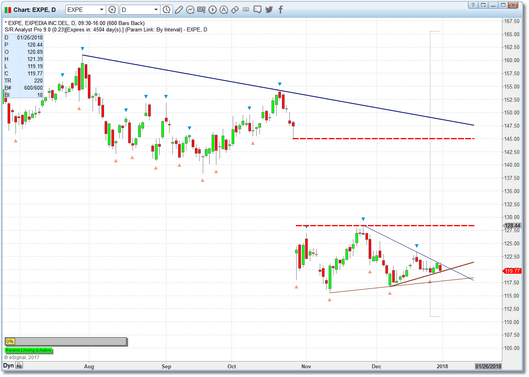
The chart component of S/R Analyst Pro allows you to quickly visualize and interpret any trend lines, S/R zones, and Gap zones that are currently in play. Some charts may contain a number of these constructs while others may display only one or two. The pieces that comprise the S/R Analyst Pro chart component are as follows:
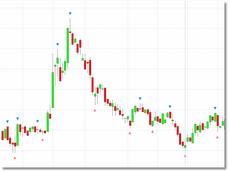
These are small colored triangles drawn above and below price bars and they simply identify points in time where price was turned around (they are NOT entry signals!). All trend lines and S/R zone constructs are based on these pivot points. You can adjust the sensitivity of the pivot detection logic by adjusting the Pivot Size parameter in the Settings menu.
The menu settings related to Pivot points are:
|
|
Trend Lines |
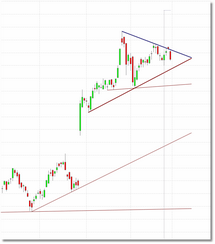
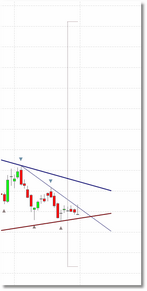
Both upper and lower trend lines are automatically calculated and drawn by the chart component. These lines are based on the pivot points discussed above. A number of the parameters in the Settings menu govern the construction of these lines if you decide that you want to customize the trend line detection logic.
Upper trend lines are considered to be resistance while lower trend lines are considered to be support. By default, upper trend lines will be drawn in blue while lower trend lines will be drawn in dark red.
The menu settings related to trend lines are:
|
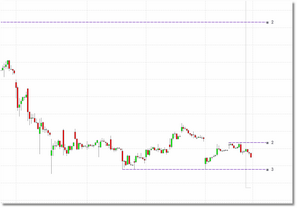
S/R zones are price levels that have acted as support and/or resistance in the past and, it is assumed, will again in the future. S/R zones are calculated by S/R Analyst Pro using pivot points. All of the pivot points are collected and analyzed for clustering and any resulting clusters are identified as support/resistance zones. Each S/R zone is rated by the number of pivot points that touch that particular price level. The more pivot points that touch the price level, the stronger the support/resistance zone is likely to be. S/R zones are displayed as colored horizontal lines on the chart and they are drawn from the oldest pivot that touched that particular price level. Note that we use the terms support/resistance zone, support/resistance line, S/R zone and S/R zone line interchangeably within this document
S/R zone lines are drawn as dashed purple lines by default. The number displayed to the right of each S/R zone line indicates the strength, and if the S/R zone has not yet been broken by price the a small square will be displayed at the end of the line. Price must actually close through a S/R zone to invalidate it.
The menu settings related to S/R zones are:
|
|
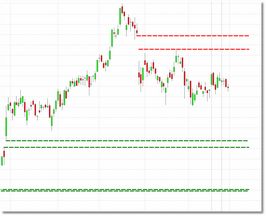
Gap zones are areas on the chart where price has gapped from one bar to the next. There are two types of Gap zone situations that the indicator will highlight: a Gap Up situation is where the low of the current price bar is greater than the high of the prior price bar and a Gap Down situation is where the high of the current price bar is less than the low of the prior price bar.
A Gap Up zone will tend to offer support to future price action and a Gap Down zone will tend to offer resistance to future price action.
Gap zones are drawn as dashed green or red lines by default.
The menu settings related to Gap zones are:
|
|
Ignore Zone is a term we use to describe an area on the price chart where trend lines will not be checked for
The menu settings related to the Ignore Zone are:
|
|
Activity Monitor |
This is a small dialog that will display near the bottom-left of the chart. See the discussion under Activity on the Watchlist Operation page.
|
Params Linking Indicator |
Params Linking allows the copy of S/R Analyst Pro running in a watchlist to share its parameter settings with the linked copy that is running in a chart. See the discussion under the Params Linking topic.
|
When you put all of this together you get a clear and concise view of the support/resistance landscape for any security and in any timeframe.
In the chart snapshot above we can see that we have consolidation in the form of a triangle with a large gap zone above us. While this security currently looks more bearish than bullish, if price does break out above this consolidation our first price target would be the bottom of the gap zone at around 129.00 and our secondary target would be the pivot high that is just above the Gap zone at 154.24. Our initial stop would be just below the lower trendline at around 118.00. Once price closes inside of the Gap zone, the stop would be moved just below that level at 128.40 to lock in a profit and, thereafter, the stop would be trailed with price.
All of the cosmetics for the chart component can be adjusted via the parameters menu. See the Settings section for details on these options.
|
Note: Remember that if params linking is active, the chart component of S/R Analyst Pro takes most of its settings (pretty much all except the cosmetic settings) directly from the watchlist component. If you go into the eSignal Edit Chart dialog and adjust the parameters, the chart component of the indicator will ignore your changes and continue to use the settings that the watchlist instructs it to use. If you want to directly control the parameters in the chart component of S/R Analyst Pro you MUST first uncheck the "Activate Params Linking?" setting in the chart component's parameter menu.
Also, if you ever want to run the chart component of S/R Analyst Pro standalone (i.e., not attached to a watchlist) then you should uncheck the "Activate Params Linking?" setting in the parameter menu. |
Access the Settings
|
To access the S/R Analyst Pro chart parameters menu where you can view and edit program settings, please follow these steps: |
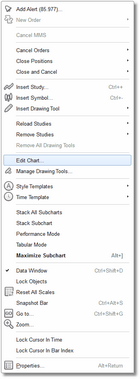
•Click anywhere in the chart and select the Edit Chart option from the pop-up menu.
|
|
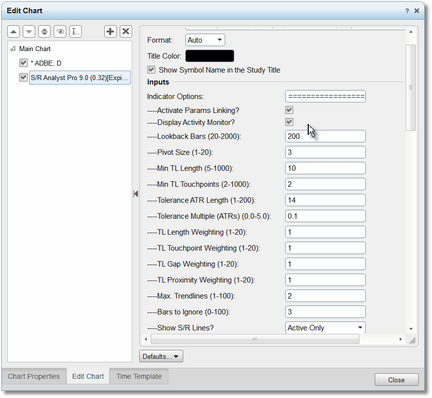
•You will now be looking at the Edit Chart dialog.
•You can scroll up or down through the available parameters and make any changes needed. • •Click on the Close button at bottom-right of the dialog when done.
•For more information on the available parameters please review the Settings section.
•Don't forget about params linking! If activated, the chart component of S/R Analyst Pro will get most of its parameters from the copy running in the watchlist and it will ignore any changes (other than cosmetic) that you make in the Edit Chart dialog. If you need full control over the chart indicator parameters you MUST uncheck the 'Activate Params Linking?' check-box under General Options. |
See Also:

