Introduction
S/R Analyst Pro allows you to visualize the entire support/resistance landscape for any security in any interval, and it does this job very well. In addition to automatically drawing trend lines and identifying S/R zones and Gap zones, by design it also highlights various important consolidation patterns such as triangles, flags, pennants, and wedges.
To recap, when using S/R Analyst Pro you will have a watchlist component attached to a chart component, and the watchlist will be populated with the list of securities that you typically trade in the bar intervals that you prefer. The watchlist component will monitor your list of securities in realtime and will generate alerts when price touches any of the support/resistance constructs, such as trend lines, S/R zones, or Gap zones.
So when an alert is generated, what do you do?
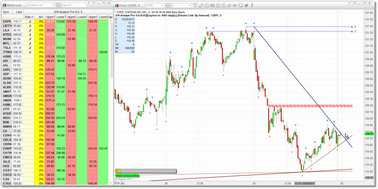
Well, the first thing you want to do is to look at the chart. To do this, click on one of the S/R Analyst Pro cells in the row that generated the alert and the attached chart will now display all of the trend lines, S/R zones, and Gap zones associated with that security in the interval you have selected (click on the example snapshot above).
In the watchlist, those cells drawn in the Alert Condition color indicate the specific construct(s) that generated the alert in the first place, so you will know where to look on the chart. Also, if running during market hours, take a look at the Activity Monitor (or the Activity column in the watchlist) to get an idea as to how active the current trading is in this security.
Keep in mind that not all alerts will be tradeable events. The system is designed to alert you whenever any of the support/resistance constructs are touched by price, but this does not necessarily mean that a breakout or a bounce is in progress.
Checklist
When a signal is generated and you pull up the chart, there are some questions to ask yourself:
Do I even want to trade in this direction? |
If you only trade long and this is a breakout to the downside then move on to another signal.
|
What is the current trend of this security? |
Take a minute to compress the chart so you can view the recent behavior of the security. Jump to a higher timeframe if you need to in order to get the bigger picture.
The security must exhibit a trend (or recent behavior, such as a price pattern) that supports the breakout or bounce that you are considering. If this is not immediately apparent then move on to another signal.
For example, if this is a bullish breakout signal on a security that is currently flat, downtrodden, or thinly traded then you may want to pass. There are so many good opportunities out there each day that you really do not need to waste your time on anything weak or questionable.
|
Is there enough information on the chart to visualize current support and resistance levels? |
There will be times when when a trend line or zone breakout is in progress but there is no sign of any obvious support/resistance levels near the current price action. In this situation, look to a higher-interval chart for guidance.
In those cases where price is trading at an all-time high there will be no resistance levels to work with in terms of setting your profit target. In this scenario you should look for the next whole number or the next potentially meaningful number...such as 100.00 for a stock that is near but has never been above that level.
Don't force it...if it is not obvious then move on to another signal. You need to have a clear plan of attack before you actually take a trade.
|
Is an obvious price target visible on the chart? |
Check above the breakout level for any other trend lines, S/R zones, Gap zones, or recent pivot highs. All of these represent possible resistance, and the closest resistance level to the breakout generally should at least be considered as the initial price target.
However, there are no hard and fast rules here. If a price pattern is present (such as a triangle, flag, pennant, wedge, etc.) then that may very well impact your selection of a price target (see Selecting Target/Stop)
As for Gap zones, the end of the Gap zone tends to offer more support/resistance than the beginning of the Gap zone. So, for example, if you are trading long into a Gap down zone, the bottom of the zone will tend to offer more resistance than the top of the zone. If you break into the zone you can select the next obvious resistance level that is above the entire Gap zone as your target. Vice-versa for Gap up zones.
See the comment above regarding using a higher interval chart in those situations where there is not enough information on your trading timeframe chart.
|
Is there an obvious location below the breakout where you can place your initial stop? |
For a wide variety of reasons not all trades will have a positive outcome, so you need to protect yourself with a stop that is placed in a logical location. Check below the breakout level for any other trend lines, S/R zones, Gap zones, or recent pivot lows. All of these represent possible support, and generally you should look to place your stop just below the support level that is nearest to current price.
See the comment under targets above regarding Gap zones. When selecting a Gap zone as your stop, set your stop just below the top of the Gap zone (for a long stop) or just above the bottom of the Gap zone (for a short stop).
When deciding where to place your stop, you also need to consider the average range of recent bars. If the first level of obvious support is within range of the average bar (based on recent volatility) then consider moving down to the next closest support level for your stop.
When placing your stop (or target) it is important to plan for the worst-case scenario...don't make any assumptions and definitely leave "hope" out of the equation. If, after you define a realistic profit target and stop loss, the reward/risk ratio does not pan out then move on to another signal.
|
What is the reward/risk ratio? |
Now that you have your stop loss and profit target defined, is the trade worth the risk? If your potential loss in this trade is greater than your potential profit then this trade does not have a good reward/risk ratio and should be skipped.
You can make your own decision in terms of what represents a good reward/risk ratio but, in general, you should only consider trades where your potential profit is at least 1.5 times your potential loss.
A good tool to help visualize this is the eSignal Reward/Risk widget which is available under the Drawing Tools menu on your chart. They have a freehand widget (which we use) and one for long trades and another for short trades that use previously set values.
|
Does recent price action form a recognizable pattern that may increase the odds of the trade? |
Here we are looking for things like a sequence of higher-highs/higher-lows, or price patterns such as triangles, flags, pennants, wedges, channels or anything else that indicates consolidation. All things being equal, breakouts/breakdowns from consolidation tend to be much stronger moves.
|
Are there any news events that may explain the current price action and influence your decision to trade? |
Depending upon your timeframe this may not be applicable but, when possible, check for recent news events that impact the security (or the sector, or the market as a whole). Unless you have a lot of experience under your belt, trading against the news is rarely profitable.
|
While we focus on identifying and confirming "breakouts" in the checklist above, there are other possibilities to consider. For example, price may currently be touching a S/R zone or Gap zone that has been tested several times in the past. If this level appears to hold once again (i.e., price 'bounces' off of the support/resistance level) then you might want to consider a trade in that direction, with a stop placed just beyond the zone being tested. Use the approach discussed in the checklist to identify the most logical price target, and then determine the reward/risk ratio of the setup.
If you make it through the above checklist and still feel good about the opportunity then all that is left is to enter the trade. Even with the best laid plans, though, you have to accept the fact that what happens in the market is ultimately outside of your control, and there will be losing trades. However, if you are consistent in selecting only those trades that offer a good reward/risk ratio then you should do well. If you keep your losses small then one winning trade can easily make up for a string of losers. As you gain experience with support/resistance trading your hit rate will improve.
Examples
Let's take a look at some examples:
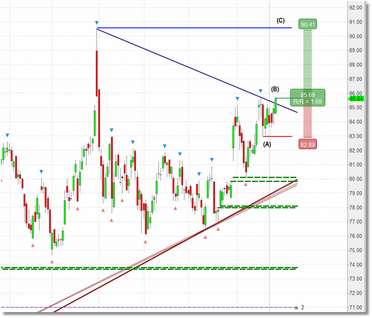
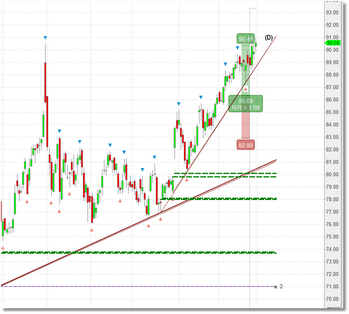
Here we have a upper trend line breakout condition at point (B). Long term (not visible above) the security is in a strong uptrend. We also see a recent sequence of higher-highs/higher-lows and some consolidation near the trend line, all bullish signs. Logical price target is the recent high at 90.41, marked as (C) on the chart. The nearest obvious support is a gap-up at the 80.00 level, but the logical stop in this case is the pivot low just below the most recent leg up (marked as (A) on the chart) since, if this level fails, then price is likely heading back down. We apply the eSignal Reward/Risk tool based on these levels and see that we have a 1.69 reward/risk ratio which is good. Price target is ultimately reached at point (D).
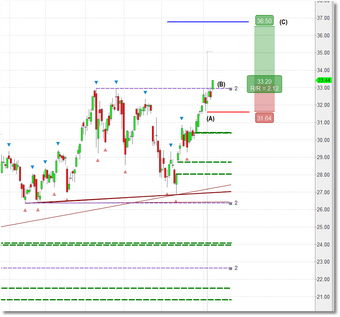
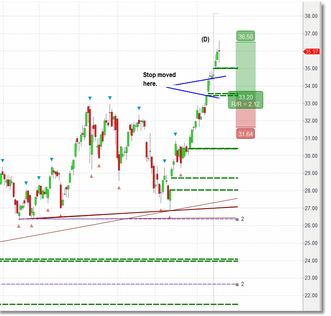
Here we have a S/R zone breakout at point (B). Long term (not visible above) the security is in an uptrend. There is no obvious resistance level on the trading timeframe chart so we have to look at a higher interval chart, where we see that the next level of resistance is at 36.50, which becomes our price target at point (C). There is a small Gap zone just before the most recent leg up, but we have a lower pivot which is closer to current price at point (A) so we place our stop at 31.64. We apply the Reward/Risk tool and see that we have a reward/risk ratio of 2.12, which is very good. After breaking out of the S/R zone price continues moving up until eventually our price target is hit at point (D). We trailed our stop to just below the Gap zones that were created during the move up.
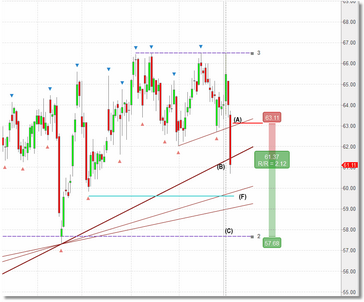
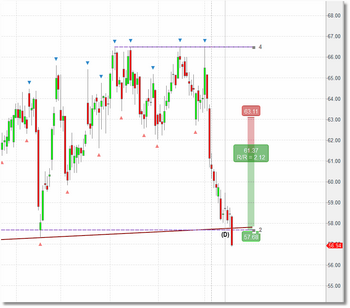
This is a short trade example. Price was repeatedly tested at 66.50 (S/R zone) and failed. Alerts were generated for two trend line breaks at points (A) and (B). Entry at the breakdown of the 2nd (stronger) trend line break at point (B). Stop set just above first trend line at point (A). Price target is the strong S/R zone at point (C). Reward/risk ratio comes out to 2.12 which is good. We need to be cautious at point (F) since that represents a prior swing low and the intersection with an existing trend line. If/when price reaches that level we will move our stop down to breakeven. Price moves down and subsequently takes out our target at point (D).
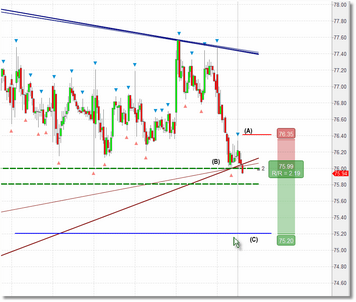
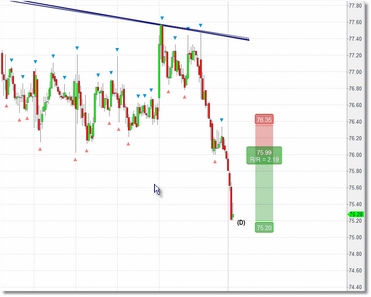
In this setup we have a breakdown of two lower trend lines as well as the top of a Gap zone at point (B). The security has recently been bearish, has tested the top of the Gap zone several times, and has formed relatively tight consolidation just above the gap. The stop would be placed just above this consolidation at 76.35 (point (A)). No obvious support on our trading timeframe chart so we jump to a higher interval chart and find a pivot low at 75.20, and this will be our target at point (C). Reward/risk ratio is 2.19 which is good. Once price reaches the bottom of the gap at 75.80 we move our stop to breakeven at point (B). Once clearing the gap price ultimately reaches our target at point (D) and shows little hesitation.
Conclusion
If all of this is new to you, the best way to get up to speed is to scan through charts after market hours and look for setups in the historical price data. Work on identifying entry points (S/R Analyst Pro does most of that for you) as well as selecting the correct profit target and stop loss levels. Experiment with the eSignal Reward/Risk tool so that you can use it quickly and effectively when trading in realtime. Using the eSignal Bar Replay feature you can walk through trades bar-by-bar for a more realistic experience.
When you feel ready to tackle some real trades, start off using the eSignal paper trade module so you are not risking your own money. If/when certain trades don't work out, go back and check your initial assessment and see if there was anything you missed or something you should have done differently. S/R Analyst Pro provides everything you need to make informed trading decisions and, with practice, you will gain both confidence and experience.
See Also:
