Selecting a Profit Target and Stop
Here are some more in-depth examples of the thought process involved in selecting a profit target and a stop loss once you have identified a signal/setup that you are interested in trading.
In this first example we have two possible approaches to consider. We can treat this as a standard trend line breakout or, based on our interpretation of the chart, we can treat this as a cup and handle price pattern. We chose to go with the price pattern approach, but there is no absolute right or wrong answer here. The bottom line is that S/R Analyst Pro alerted us to this setup, how we choose to analyze and ultimately trade the setup is entirely up to us.
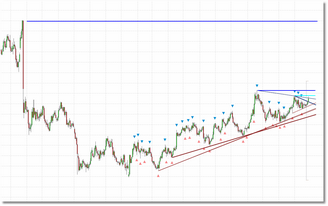
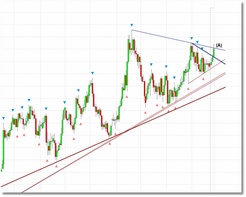 See the image to the left. Here we have an interesting setup. Price has been on an uptrend (we have had a series of higher-highs and higher-lows), we have had some consolidation and what looks to be a possible cup and handle price pattern evolving. The initial signal is the break of the upper trend line at point (A).
If this is a cup and handle pattern then, instead of acting on the trend line breakout, we might actually want to wait until we have a breakout of the handle portion of the cup and handle pattern, which is drawn in cyan in the image to the right.
In terms of selecting the profit target, initially it looks like we have two levels to consider. The first is the actual top of the cup and handle formation (drawn in blue) and the second is the next most recent pivot high above our current price level, also drawn in blue. To see this we had to compress the chart (see image on right). When analyzing a potential setup it is always a good idea to step back and look at the bigger picture, either by compressing the chart or switching to a higher bar interval.
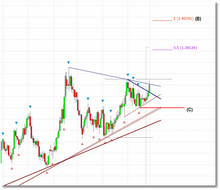
If we believe this to be a cup and handle pattern then there is a 3rd option to consider for our initial price target. For this type of pattern the move we can expect is the distance from the bottom of the bowl to the top of the cup. In the image to the left we have applied the eSignal Extension tool and the red line at 1.40701 represents the end of the expected move. It is marked as point (B).
So, for now, we will use this as our price target, but we will pay close attention to the price level that represents the top of the cup and handle formation since, if things are going to fall apart, it will likely happen at that level.
The initial stop is a bit easier to identify. The most recent pivot low at the bottom of the handle portion of the pattern is a logical candidate. If this level fails then our analysis was incorrect. This is marked as point (C) on the image to the left.
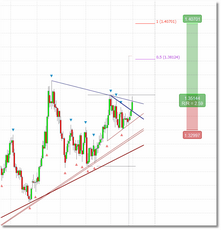
The next step is to apply the Reward/Risk tool to our levels and see what we have in terms of a reward/risk ratio. In the image to the right we have a ratio of 2.59 which is very good.
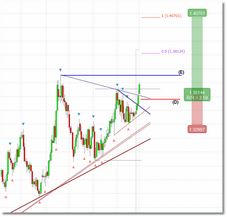
So the plan will be to wait for the breakout above the cup. When that happens we would seriously consider immediately moving our stop from the existing pivot low location to just below the original trend line, at point (D) in the image to the left. Target remains the same but our reward/risk ratio has improved.
If/when price breaks above the top of our cup and handle formation at point (E) we would move our stop to breakeven. This represents the final resistance zone that we have to deal with and if we get past this we would expect the pattern to at least get near our expected target.
As price moves up from here we would trail our stop at a reasonable distance behind price to lock in any profits.
This next example is a bit more straightforward since it is a simple trend line breakout. However it does require some thought and planning since our bullish signal may turn out to be quite bearish.
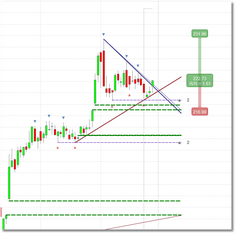
In terms of the chart, price has recently been in a bullish trend and we have several gap-up zones, which is also a bullish sign. 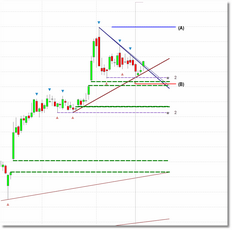
Price is currently in consolidation...could be a flag or pennant pattern, or perhaps a triangle which would actually be a bearish sign. At this point, though, given that price has already moved above the trend line it looks more like a pennant, so we will stick with our bullish bias. If price does in fact drop to the nearest S/R zone we may reconsider. Possibly close the long trade at a small loss and consider a trade to the short side.
Our price target would be the pivot high at the top of the formation, marked as point (A) in the image to the right. Our initial stop will be set just below the top of the nearest Gap zone, marked as point (B). Placing the stop just below the S/R zone instead of the Gap zone would be just fine as well. Our thought process is that price may continue to compress for a few more bars before actually breaking out on volume, and in that case the S/R zone will likely get taken out. While we want to give the trade a bit of breathing room we will quickly admit defeat if our stop in the Gap zone is hit, and we may even decide to close the trade early if that S/R zone is taken out on any volume.
We apply the Reward/Risk tool (image on left) and we have a 1.61 reward/risk ratio which is acceptable. After entry we would plan on trailing our stop at a reasonable distance behind price to lock in any profits.
If price does NOT move in our direction, we will monitor that S/R zone carefully and if price pushes through that zone on high volume we will exit the long trade at a small loss and try to get set up for a trade to the short side. But only if the reward/risk numbers justify it.
As mentioned above, there is no absolute right or wrong answer when analyzing a setup and selecting targets and stops as long as you are logical and consistent in your approach and you apply some common sense. Put 10 traders in a room and show them all the same signal and you will likely get at least 5 different interpretations. Each of them will make decisions based upon his or her experiences in the market and their overall confidence level. Use all of the information that you have available to make your decisions and, most importantly, accept the fact that you will be wrong a fair amount of the time. Stick with setups that offer good reward/risk ratios and your winners will outweigh your losers.
When selecting signals to analyze further, pick those that jump out at you. Chances are that if it looks interesting to you, then it will look interesting to lots of other traders as well. It is no accident that most of the "interesting" setups you find will end up being some kind of price pattern formation. Trend lines and S/R levels tend to bring these price patterns into focus. These patterns have been around since trading began, and most have certain rules and guidelines associated with them that will assist you in setting up your trade. The StockCharts Chart School is a good resource for this.
