Getting Started
 The easiest way to get started is to pull up one of the S/R Analyst Pro Demo pages that were included as part of the installation (see Demo Pages for a description of the pages included). Which one you select is entirely up to you. Once you have loaded one of the pages you can customize it as needed and save it under a new name. The benefit to using one of the pre-installed pages as your starting point is the fact that the watchlist/chart symbol/interval linking has already been correctly set up and the watchlist and chart components are already attached to the correct eSignal Time Template.
If you have not already installed S/R Analyst Pro on your computer, you can access the installer here. When you run the installer the S/R Analyst Pro files will be installed into a eSignal Formulas folder called "SRAnalystPro".
|
To load one of the pre-installed S/R Analyst Pro pages please follow these steps: |
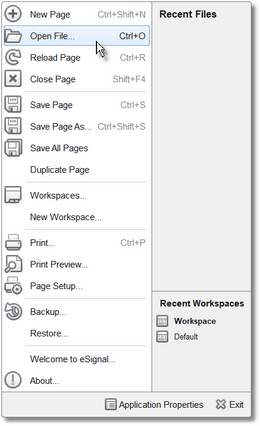
•Click on the blue eSignal icon at the top-left of the eSignal program and click on the Open File... option.
|
|
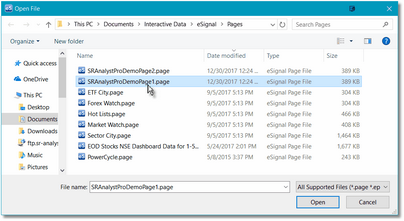
•You should now be looking at the contents of the Pages folder.
•Scroll down until you see the S/R Analyst Pro Demo pages. Select one and click on the Open button at the bottom-right of the dialog. |
|
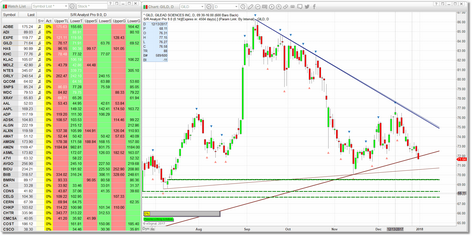
•The page you selected will be loaded into eSignal. You might need to adjust the height/width of the chart and watchlist components to match your particular monitor size and resolution.
•Depending upon your eSignal settings it is possible that when you load a page for the first time the components will be reversed. If that is the case, just use your mouse to drag the chart and watchlist components around until your screen matches the image on the right.
•Regardless of which S/R Analyst Pro Demo page you select, you will see that the watchlist component(s) are already linked to their corresponding chart component(s). If you click on a row in the watchlist the correct information for that symbol and interval will be displayed in the chart.
•You can sort the watchlist on any of the S/R Analyst Pro columns and you can also remove any of the columns that you don't feel you need. It is recommended that you sort primarily on the Status column.
•You can now customize the page by adding additional (or completely different) symbols (see Adding List of Symbols), selecting a different bar interval, and adjusting the S/R Analyst Pro parameters to suit your needs.
•When you are done be sure to save the page under a new name. |
See Also:


