
HPC Pro is available in 3-month and 12-month auto-renewing subscriptions, as a 12-month one-time license (no auto-renewal), and as a one-time Lifetime license. For more information on license pricing, please review the Subscriptions topic, or visit the Harmonic Pattern Collection product page.
The majority of this User Guide focuses on the Harmonic Patterns Indicator since it is the most complex component with the most options. All of the other indicators are covered under the Harmonic Indicators topic. If you have questions, please check the FAQ section first as we are posting common questions and answers to that section as they come in.
Harmonic Patterns Indicator
The Harmonic Patterns Indicator will track a total of 10 harmonic patterns simultaneously (7 standard pattern types and 3 variations) and it will operate under any security and bar interval available in eSignal. The same indicator will operate in a eSignal chart as well as in a eSignal watchlist. It will also operate in the eSignal Market Screener Plus.
Individual patterns can be toggled on or off via the parameters dialog, and settings are provided that will allow you to adjust the pattern requirements, apply filtering, and adjust the cosmetic properties. Alerts (audible, pop-up, and email) are generated when the indicator is running in either a chart or a watchlist, and the alerts can be filtered. See the Settings section for detailed information on all of the parameter options.
The patterns that comprise the indicator are:
•ABCD® Pattern
•Bat® Pattern and Alternate Bat® Pattern
•Gartley® Pattern and Gartley886® Pattern
•Butterfly® Pattern
•Crab® Pattern and Deep Crab® Pattern
•Shark® Pattern
•5-0® Pattern
When loaded into a chart, the Harmonic Patterns Indicator will perform the following tasks:
Confirmed Patterns
•Identify and draw all completed patterns that may have formed in the historical data. We refer to these as Confirmed patterns. Now, in general, unless the pattern was confirmed within the last few bars or so it is probably not actionable from a trading standpoint. However, reviewing historical Confirmed patterns can be extremely useful in terms of building a list of securities (and bar intervals) where specific patterns are more prevalent and profitable. By default, the Confirmed patterns are drawn in green (bullish) and red (bearish) but the colors can be adjusted via Settings.
 Bullish Confirmed Pattern (Bat) |
 Bearish Confirmed Pattern (Gartley) |
Pending Patterns
•Identify and draw all patterns that are occurring right now, in realtime (i.e., all rule and ratio requirements for the particular harmonic pattern are met as of the current, developing bar). Depending upon price action in the current bar, as well as the next bar, the pattern may or may not become a Confirmed pattern. We refer to these as Pending patterns. Being aware of Pending patterns is critical since it gives you the option of taking a position before the pattern is confirmed. By default, all Pending patterns are drawn in blue but the color can be adjusted via Settings.

Pending pattern (Shark)
Potential Patterns
•Identify and draw patterns that have completed all but their final leg. These patterns may or may not reach the Pending or Confirmed pattern stage but we can plot the portion of the pattern that has completed and make projections in both price and time as to where price would have to travel in order to complete the pattern. We refer to these as Potential patterns. Depending upon the specific harmonic pattern, as well as the settings being used, several Potential patterns may be available at any given time so the pattern nearest (in price and time) to potential completion will be displayed. The completion zone, which consists of a time component and a price component, is displayed for each Potential pattern.
•This Potential pattern feature gives you an important heads-up on patterns that are likely to develop in the near future and can help you plan your trading day. Note that Potential patterns will not be displayed if a Pending pattern has currently formed. By default all Potential patterns are drawn in grey but the color can be adjusted via Settings.
 Bullish Potential Pattern (Bat) |
 Bearish Potential Pattern (Deep Crab) |
|
Note: There are a number of factors that can lead to different patterns being displayed for the same currency pair and timeframe over different platforms, or even different brokers on the same platform. •The biggest issue is the fact that Forex is a decentralized market. It is comprised of several 'contributors', such as Gain, FXCM, Oanda, CNB, HSBC, etc. So depending upon your charting platform and/or your broker, your data for a particular pair may come from a specific contributor OR may be based on a composite of several contributors. •There can be very small to very significant OHLC price differences when comparing data from one contributor to another (or when comparing a composite to a specific contributor). Harmonic Patterns are based on very precise measurements and ratios. So we measure the component legs of each pattern (i.e., from a bar high to a bar low further down the line) and calculate ratios to express the relationship between the various legs. •Even small differences in price can lead to significant differences in the ratios which might kick a pattern out of the acceptable range. So we end up with the situation where we see a particular pattern with data from one broker, but we do not see that pattern when using data from a different broker. •Now, while we are constantly working on ways to provide some elasticity to the measurements (while not compromising the integrity of the patterns) it is unlikely that we will ever be able to provide a 100% match from broker to broker due to the data issue described above. |

Operation
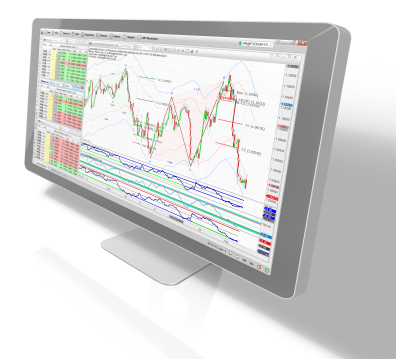
As mentioned above, the new Harmonic Patterns Indicator will operate in a watchlist (or the eSignal Market Scanner Plus) which, in turn, is linked to a chart. This powerful feature gives you the ability to monitor baskets of securities for pattern activity on any bar interval without having a large number of charts open. When run in a watchlist or scanner the indicator will track Pending, Potential, and Confirmed patterns and generate alerts in the watchlist when new patterns are found. You can then click on the row in the watchlist/scanner and the pattern information will be pulled up in the chart for that symbol/interval combination.
You can utilize one watchlist linked to a chart, as in our example below, or you can set up multiple watchlists with each one monitoring a different bar interval...it is entirely up to you. See the Watchlist Operation section for more information.

Watchlist running the Harmonic Patterns Indicator linked to a chart.
To get started, go to the Quick Start section, follow the instructions, and you will be up and running in no time.
See Also:
