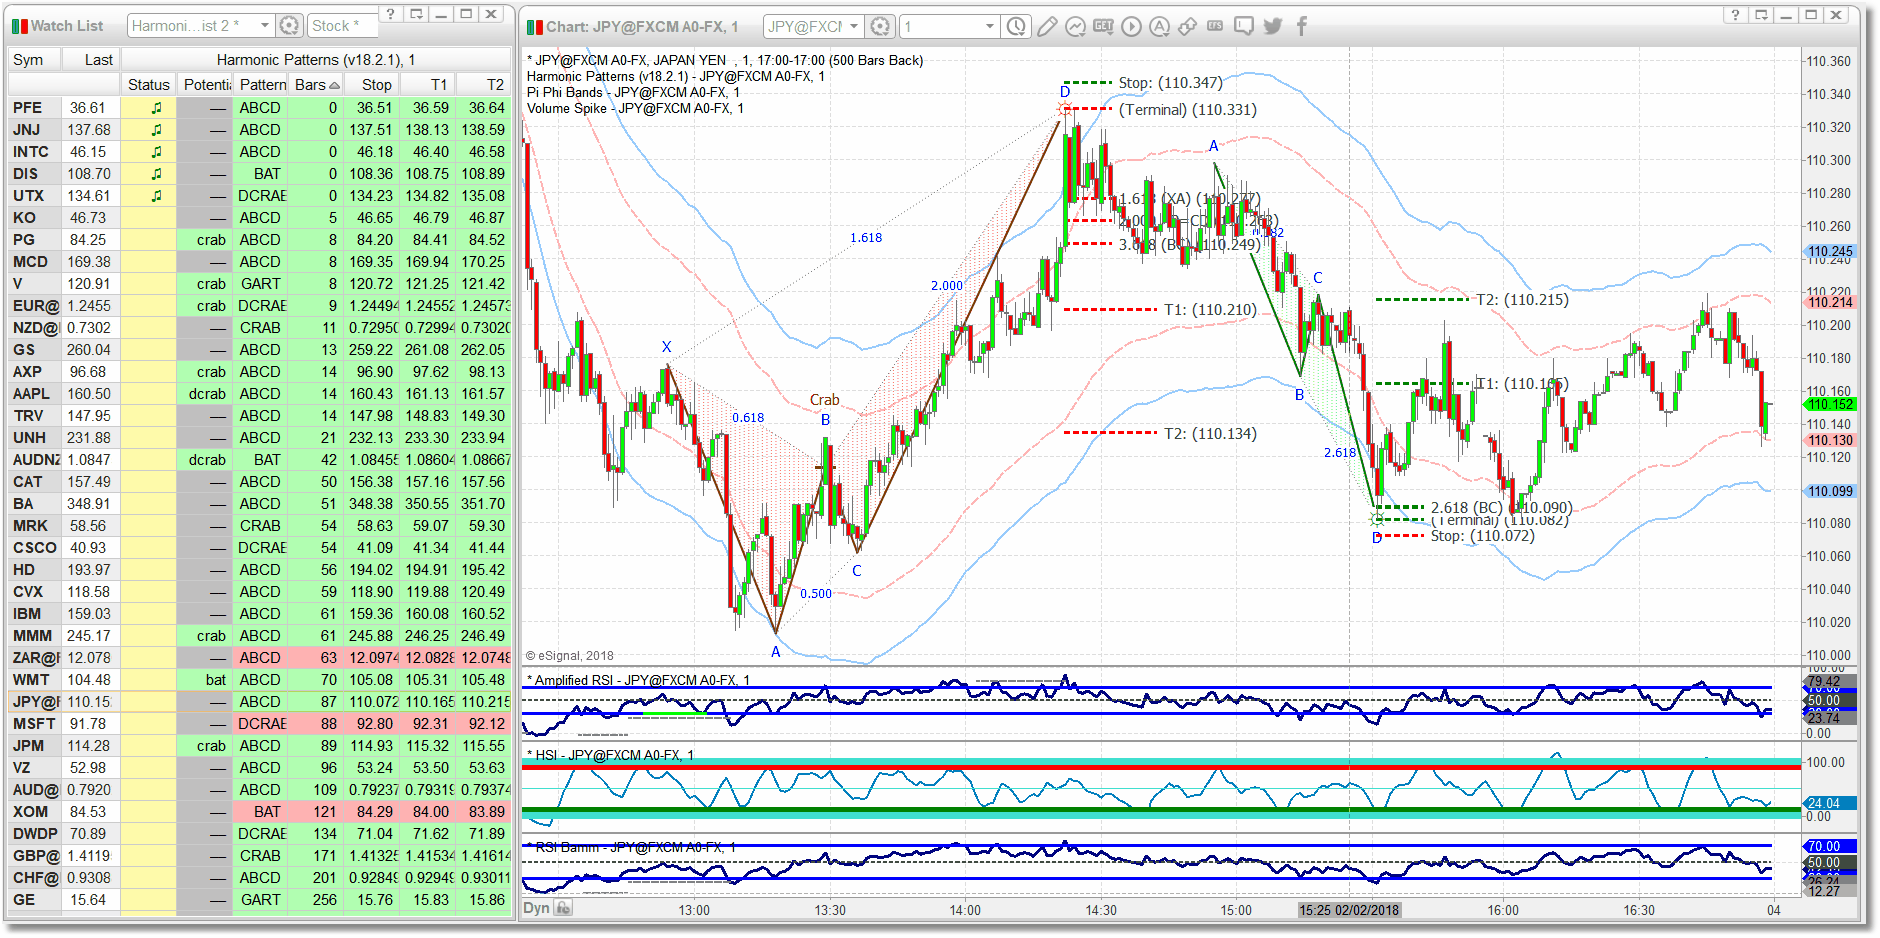
Watchlist/Scanner Operation
Using the Harmonic Patterns Indicator in a watchlist (or the eSignal Market Scanner Plus) is simply a matter of loading the indicator into your eSignal watchlist/scanner and then setting the bar interval and adjusting the parameters, as needed. You should also apply a Time Template to your watchlist to ensure that enough price bars are available for the pattern detection logic to operate. Once the indicator is loaded it will display all patterns found in the historical data, as well as any pending patterns or potential patterns that may be available. You can fine-tune the operation of the indicator via Settings.
It is strongly recommended that you use one of our pre-installed demo pages (see Quick Start). In the demo pages we have already applied the correct eSignal Time Template and we have set up the correct watchlist/chart symbol and interval linking.
|
Multiple copies of the Harmonic Patterns Indicator can be loaded into a single watchlist and each instance can be configured to monitor a different bar interval and/or use different settings. The only limitations will be the amount of RAM available, the power of your computer's processor, and the size of the watchlist (i.e., number of symbols).
|
The Harmonic Patterns Indicator recognizes when it has been loaded into a watchlist/scanner instead of a chart, and adjusts it's behavior accordingly. When run in a watchlist the indicator will display 7 columns:
Column |
Description |
Status |
This column is used to highlight any alert conditions. The watchlist component will track Pending pattern alerts as well as Confirmed pattern alerts. When a Pending pattern alert is triggered for a particular security a double musical note (♫) will be displayed in the Status column. When a Confirmed pattern alert is triggered a single musical note (♪) will be displayed. In both cases the color of the musical note (i.e., Green or Red) will indicate the pattern direction.
|
Potential |
This column will display the name and indicate the direction of any Potential patterns that may be forming in the security being monitored. If a Potential pattern is present the pattern name, in lowercase, will be displayed in this column and the color will indicate pattern direction.
|
Pattern |
This column will always display the most recent Pending or Confirmed pattern. The pattern name, in uppercase, will be displayed and the color will indicate pattern direction.
|
Bars |
This column displays the age, in bars, of the most recent Pending or Confirmed pattern. A Bars value of 0 means that the pattern is completing as of the current price bar and, in this case, it is considered a Pending pattern. A Bars value greater than 0 indicates a Confirmed pattern and represents the distance back to the last point of the pattern. If there are no Confirmed or Pending patterns present for a particular security then a grey background is used and a dashed line is displayed.
The Bars column is typically used as the primary sort so that more recent patterns are displayed at the top of the watchlist/scanner.
|
HOP |
This column displays the Harmonic Optimized Price (HOP) value for the Pending/Confirmed pattern displayed in the Pattern column, if any.
|
T1 |
This column displays the first price target for the Pending/Confirmed pattern displayed in the Pattern column, if any.
|
T2 |
This column displays the second price target for the Pending/Confirmed pattern displayed in the Pattern column, if any.
|
If screen real estate is tight, you can hide any of the columns that you don't feel you need. Just right-click in the column header/title and select the Hide option from the drop-down menu.
The Harmonic Patterns Indicator requires a large number of price bars to perform the pattern search and, by default, a watchlist will only provide a handful of bars to any indicators that are running in the watchlist. The best approach is to load one of the demo pages that were included as part of the installation as these are pre-configured with the correct Time Template (see Quick Start).
If you decide to create your own page, please be sure to apply a eSignal Time Template to the watchlist that will pre-load at least 500 bars of price data.
|
If you link your watchlist to a chart it is highly recommended that you apply the exact same Time Template to both the watchlist and the chart. Also keep in mind that if you do NOT apply a Time Template to either your chart or your watchlist, the results will not match up between the two simply because, by default, a chart is allocated more bars to work with than a watchlist. Again, the best approach is to load one of the demo pages (see Quick Start) that were included as part of the installation and then just modify the page layout to suit your needs.
|
To load the Harmonic Patterns Indicator into a watchlist:
•Right-click in the header row of the watchlist and select the Add Columns... option from the pop-up menu.
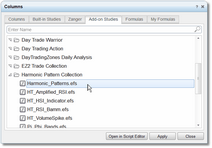
•The Columns dialog will be displayed. Click on the Add-on Studies tab.
•Then scroll down until you find the Harmonic Pattern Collection folder. Double-click on the folder to open it. Then click on the Harmonic_Patterns.efs indicator to select it, click on the Apply button, and then click on the Close button to close the dialog.The Harmonic Patterns Indicator will now be loaded in your watchlist.
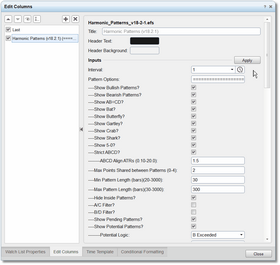
•Once the indicator has been loaded into a watchlist, you can access the parameters dialog by by right-clicking in the watchlist and selecting the Edit Columns option from the pop-up menu. The parameters dialog (called Edit Columns) will be displayed:
To change settings once the Harmonic Patterns Indicator has been
loaded into a watchlist, right-click in the watchlist and select the
Edit Columns option. Remember to click on the Apply button
when done.
|
An important difference between the Edit Studies dialog used when the indicator is run in a chart and the Edit Columns dialog used when the indicator is run in a watchlist is the Apply button. When you have finished making your edits/changes in the Edit Columns dialog, be sure to click on the Apply button that you will see near the top-right of the dialog. If you click on the Close button before you click on the Apply button, your changes will NOT be applied.
|
•You will note that the very first parameter in the Edit Columns dialog is Interval. This only appears when the Harmonic Patterns Indicator is loaded into a watchlist. The default value will always be "D" for Daily. Be sure to change this to the actual bar interval on which you wish to scan for patterns.
•Aside from the Interval option, there is only one other parameter that is specific to running in a watchlist and that is the Only in Range? option. If this option is checked (which it is by default) then Potential patterns will only be displayed in the watchlist if they are "near" their completion zone. "Near" is defined as current price being within 10% of the min/max range of the completion zone and the current price bar being no further away than 3 bars from the completion zone. This option serves to filter out Potential patterns that may be several bars away from possible completion and, therefore, are not pertinent at the present time. The Only in Range? option only applies when the indicator is run in a watchlist and has absolutely no affect if the indicator is run in a chart since all potential patterns, regardless of how far away they might be from completion, will always be displayed in the chart.
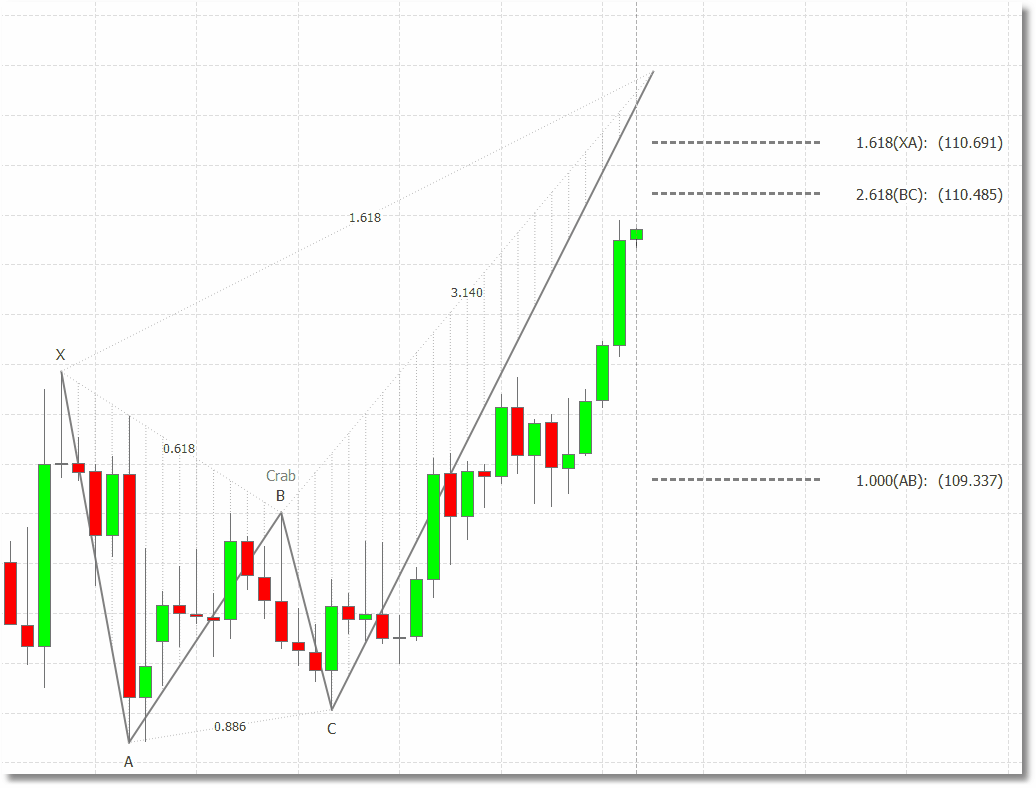
•The image above is a chart example of a Potential Crab pattern that would pass the watchlist Only in Range? filter test. Price bars have already entered the completion zone from a time standpoint, and the current price bar is less than 10% above the min/max completion zone range.
•If the number of symbols in your watchlist is larger than the physical watchlist display (i.e., not all symbols are visible in the watchlist) then be sure to uncheck the Hibernation Mode option in the watchlist menu. This will ensure that even those symbols that are not currently in the field of view will continue updating and searching for patterns. To access the Hibernation Mode option, click anywhere in your watchlist to make it the active component, and then click on the Watch List button in the toolbar at the top of the eSignal application. A drop-down menu will appear and Hibernation Mode should be near the top. Just uncheck it if it is currently checked.
See Also:


